|
Tennessee
|
62-1120025
|
|||
|
(State
or other jurisdiction
of
incorporation or organization)
|
(I.R.S.
Employer Identification No.)
|
|||
|
430
Airport Road
|
||||
|
Greeneville,
Tennessee
|
37745
|
|||
|
(Address
of principal executive offices)
|
(Zip
Code)
|
|
Common
Stock, $0.01 par value
|
The
NASDAQ Stock Market LLC
|
|||
|
(Title
of class)
|
(Name
of exchange on which registered)
|
|
Large
accelerated filer x
|
Accelerated
filer ¨
|
Non-accelerated
filer ¨
|
|
Page
Number
|
|||
|
3
|
|||
|
11
|
|||
|
14
|
|||
|
15
|
|||
|
16
|
|||
|
16
|
|||
|
|
|||
|
17
|
|||
|
20
|
|||
|
21
|
|||
|
31
|
|||
|
31
|
|||
|
31
|
|||
|
31
|
|||
|
34
|
|||
|
34
|
|||
|
34
|
|||
|
34
|
|||
|
34
|
|||
|
34
|
|||
|
|
|||
|
34
|
|||
|
35
|
|||
|
F-2
|
|||
| Exhibit Index | |||
|
Business
|
|
•
|
Freight
forwarders obtain requests for shipments from customers, make arrangements
for transportation of the cargo by a third-party carrier and usually
arrange for both delivery from the shipper to the carrier and from
the
carrier to the recipient.
|
|
•
|
Integrated
air cargo carriers provide pick-up and delivery services primarily
using
their own fleet of trucks and provide transportation services generally
using their own fleet of aircraft.
|
|
•
|
Less-than-truckload
carriers also provide pick-up and delivery services through their
own
fleet of trucks. These carriers operate terminals where freight is
unloaded, sorted and reloaded multiple times in a single shipment.
This
additional handling increases transit time, handling costs and the
likelihood of cargo damage.
|
|
•
|
Passenger
or cargo airlines provide airport-to-airport service, but have limited
cargo space and generally accept only shipments weighing less than
150
pounds.
|
|
•
|
Increased
Outsourcing of Logistics Management to Third-Party Logistics
Providers. Air
freight forwarders are playing an increasingly important role in
logistics
management. As the growing emphasis on just-in-time processes has
added to
the complexity of logistics management, companies are finding it
more
advantageous to outsource their logistics management functions to
third
parties. According to the Council of Supply Chain Management
Professionals, the United States’ third-party logistics market grew at a
compound annual rate of approximately 17.1% between 1995 and 2005.
In
contrast to integrated air cargo carriers and less-than-truckload
carriers
that are focused on utilizing their own fixed-cost assets, air freight
forwarders can select from various transportation modes and suppliers
to
meet their customers’ shipping requirements, thereby serving their
customers less expensively. In addition, air freight forwarders generally
handle shipments of any size and offer customized shipping options,
unlike
most integrated air cargo carriers and less-than-truckload carriers.
|
|
•
|
Integrated
Air Cargo Carriers’ Focus on Overnight Freight. Integrated
air cargo carriers that transport heavy freight are targeting their
marketing efforts at higher yielding overnight freight in order to
better
utilize their high fixed-cost infrastructures. As a result, these
carriers
are outsourcing deferred freight to surface transportation providers
like
us.
|
|
•
|
Reduced
Airline Cargo Capacity. Since
the 1980’s, when the domestic airlines eliminated many of their all-cargo
aircraft, growth in demand for air cargo services has generally outpaced
the growth of aircraft cargo capacity. Airlines have decreased fleet
sizes
and are utilizing smaller aircraft, including more regional jets,
in many
markets. The short supply of air cargo space has resulted in increased
demand for surface transportation of cargo.
|
|
•
|
Focus
on the Deferred Air Freight Market. We
focus on providing time-definite surface transportation and related
logistics services to the deferred air cargo industry. We believe
that our
focused approach has enabled us to provide a higher level of service
in a
more cost-effective manner than our competitors.
|
|
•
|
Expansive
Network of Terminals and Sorting Facilities. We
have built a network of terminals and sorting facilities throughout
the
United States and Canada located on or near airports. We believe
it would
be difficult for a competitor to duplicate our network without the
expertise and strategic facility locations we have acquired and without
expending significant capital and management resources. Our network
enables us to provide regularly scheduled service between most markets
with low levels of freight damage or loss, all at rates generally
significantly below air freight rates.
|
|
•
|
Concentrated
Marketing Strategy. We
provide our services mainly to air freight forwarders, integrated
air
cargo carriers, and passenger and cargo airlines rather than directly
serving shippers. We do not place significant size or weight restrictions
on shipments and, therefore, we do not compete with delivery services
such
as United Parcel Service, Federal Express and DHL Worldwide in the
overnight small parcel market. We believe that our customers prefer
to
purchase their transportation services from us because, among other
reasons, we generally do not market our services to their shipper
customers and, therefore, do not compete directly with them for customers.
|
|
•
|
Superior
Service Offerings. Our
published schedule for transit times with specific cut-off and arrival
times generally provides our customers with the predictability they
need.
In addition, our network of terminals allows us to offer our customers
later cut-off times, a higher percentage of direct shipments (which
reduces damage and lost time caused by additional sorting and reloading)
and shorter delivery times than most of our competitors.
|
|
•
|
Flexible
Business Model. Rather
than owning and operating our own trucks, we
purchase most of our transportation requirements from owner-operators
or
truckload carriers. This allows us to respond quickly to changing
demands
and opportunities in our industry and to generate higher returns
on assets
because of our low capital requirements.
|
|
•
|
Comprehensive
Logistic and Other Service Offerings. We
offer an array of logistic and other services including:
exclusive-use vehicles (commonly referred to as truck brokerage),
dedicated fleet, warehousing, customs brokerage and shipment consolidation
and handling. In addition, during 2006 we introduced our new pick-up
and
delivery service called Forward Air Complete™, whereby
we
arrange for cargo to be picked up from and/or delivered to a
customer-designated site. These services are an essential
part of many of our customers’ transportation needs and are not
offered by many of our competitors.
|
|
•
|
Leading
Technology Platform. We
are committed to using information technology to increase the volume
of
freight we can handle in our network, improve visibility of shipment
information and reduce our operating costs. Our technology allows
us to
provide our customers with electronic bookings and real-time tracking
and
tracing of shipments while in our network, complete shipment history,
proof of delivery, estimated charges and electronic bill presentment.
We
continue to enhance our systems to permit us and our customers to
access
vital information through both the Internet and electronic data
interchange.
|
|
•
|
Technology
Advances. We
have continued to invest in information technology to the benefit
of our
customers and our business processes. In 2006, we substantially completed
the development and installation of our Terminal Automation Program
(“TAP”), a new wireless application for our Company-operated
terminals. The new system enables individual operators to perform
virtually all data entry from our terminal floor locations. The new
system
provides immediate shipment updates, resulting in increased shipment
accuracy and improved data timeliness. We believe that the TAP system
not
only will reduce operational manpower compared to our previous operation,
but also will improve our on-time performance. Additionally, in order
to support our new Forward Air Complete service offering, we
developed and installed a web-based system, which coordinates activities
between our customers, operations personnel and external service
providers.
|
|
•
|
Increase
Freight Volume from Existing Customers. Many
of our customers currently use us for only a portion of their overall
transportation needs. In addition, many of our air freight forwarder
customers are growing rapidly, and we expect that they will have
a greater
need for our services as their businesses grow. We will continue
to market
directly to these customers to capture additional freight volume.
We also
believe that there is significant potential for increased freight
volume
from passenger and cargo airlines, as well as from the integrated
air
cargo carriers.
|
|
•
|
Develop
New Customers. We
continue to actively market our services to potential new air freight
forwarder customers, such as international freight forwarders. We
believe
air freight forwarders may move away from integrated air cargo carriers
because those carriers charge higher rates, and away from
less-than-truckload carriers because those carriers provide less
reliable
service and compete for the same customers as do the air freight
forwarders. In addition, we believe our comprehensive North American
network and related logistics services are attractive to domestic
and
international airlines.
|
|
•
|
Improve
Efficiency of Our Transportation Network. We
constantly seek to improve the efficiency of our network without
changing
our infrastructure or incurring significant capital expenditures.
Regional
hubs and direct shuttles improve our efficiency by reducing the number
of
miles freight must be transported and reducing the number of times
freight
must be handled and sorted. As the volume of freight between key
markets
increases, we intend to continue to add direct shuttles. In 2006,
we substantially completed a project to expand our national hub in
Columbus, Ohio. The new expanded Columbus, Ohio facility is 125,000
square feet with 168 trailer doors. This premier facility can unload,
sort and load upwards of 3.7 million pounds in five hours. In addition
to
the expansion, we process-engineered the freight sorting in the expanded
building to improve handling efficiencies. The benefits will include
reductions in the distance each shipment moves in the building to
speed up
the transfer process, less handling of freight to further improve
service
integrity and flexibility to operate multiple sorts at the same
time.
|
|
•
|
Expand
Logistic and Other Services. We
continue to expand our logistic and other services to increase revenue
and
improve utilization of our terminal facilities and labor force. Because
of
the timing of the arrival and departure of cargo, our facilities
are
underutilized during certain portions of the day, allowing us to
add
logistics services without significantly increasing our costs. Therefore,
we have added a number of services in the past few years, such as
exclusive-use transportation services, dedicated fleet, warehousing,
customs brokerage and shipment consolidation and handling services.
In
2006, we introduced Forward Air Complete, our new pick-up and delivery
service. These services directly benefit our existing customers and
increase our ability to attract new customers, particularly those
air
freight forwarders that cannot justify providing the services directly.
These services are not offered by many transportation providers with
whom
we compete and are attractive to customers who prefer to use one
provider
for all of their transportation needs.
|
|
•
|
Enhance
Information Systems. We
are committed to the continued enhancement of our information systems
in
ways that will continue to provide us competitive service advantages
and
increased productivity. We believe our enhanced systems assist us
in
capitalizing on new business opportunities with existing customers
and
developing relationships with new customers because of the
customer-friendly, cost-saving features our systems provide,
including our real-time tracking and tracing of shipments and
electronic bill presentment.
|
|
•
|
Pursue
Strategic Acquisitions. We
intend to continue to evaluate acquisitions that can increase our
penetration of a geographic area, add new customers or increase freight
volume. In addition, we expect to explore acquisitions that may enable
us
to offer additional logistics services. Since our inception, we have
acquired certain assets of nine of our competitors that met one or
more of
these criteria.
|
|
City
|
Airport
Served
|
City
|
Airport
Served
|
|||
|
Albany,
NY
|
ALB
|
Louisville,
KY
|
SDF
|
|||
|
Albuquerque,
NM
|
ABQ
|
Memphis,
TN
|
MEM
|
|||
|
Atlanta,
GA
|
ATL
|
McAllen,
TX*
|
MFE
|
|||
|
Austin,
TX
|
AUS
|
Miami,
FL
|
MIA
|
|||
|
Baltimore,
MD
|
BWI
|
Milwaukee,
WI
|
MKE
|
|||
|
Baton
Rouge, LA*
|
BTR
|
Minneapolis,
MN
|
MSP
|
|||
|
Birmingham,
AL*
|
BHM
|
Mobile,
AL*
|
MOB
|
|||
|
Blountville,
TN*
|
TRI
|
Nashville,
TN
|
BNA
|
|||
|
Boston,
MA
|
BOS
|
Newark,
NJ
|
EWR
|
|||
|
Brownsville,
TX*
|
BRO
|
Newburgh,
NY
|
SWF
|
|||
|
Buffalo,
NY
|
BUF
|
New
Orleans, LA
|
MSY
|
|||
|
Charleston,
SC
|
CHS
|
New
York, NY
|
JFK
|
|||
|
Charlotte,
NC
|
CLT
|
Norfolk,
VA
|
ORF
|
|||
|
Chicago,
IL
|
ORD
|
Oklahoma
City, OK
|
OKC
|
|||
|
Cincinnati,
OH
|
CVG
|
Omaha,
NE*
|
OMA
|
|||
|
Cleveland,
OH
|
CLE
|
Orlando,
FL
|
MCO
|
|||
|
Columbia,
SC*
|
CAE
|
Pensacola,
FL*
|
PNS
|
|||
|
Columbus,
OH
|
CMH
|
Philadelphia,
PA
|
PHL
|
|||
|
Corpus
Christi, TX*
|
CRP
|
Phoenix,
AZ
|
PHX
|
|||
|
Dallas/Ft.
Worth, TX
|
DFW
|
Pittsburgh,
PA
|
PIT
|
|||
|
Dayton,
OH*
|
DAY
|
Portland,
OR
|
PDX
|
|||
|
Denver,
CO
|
DEN
|
Raleigh,
NC
|
RDU
|
|||
|
Detroit,
MI
|
DTW
|
Richmond,
VA
|
RIC
|
|||
|
El
Paso, TX
|
ELP
|
Rochester,
NY
|
ROC
|
|||
|
Greensboro,
NC
|
GSO
|
Sacramento,
CA
|
SMF
|
|||
|
Greenville,
SC
|
GSP
|
Salt
Lake City, UT
|
SLC
|
|||
|
Hartford,
CT
|
BDL
|
San
Antonio, TX
|
SAT
|
|||
|
Harlingen,
TX*
|
HRL
|
San
Diego, CA
|
SAN
|
|||
|
Harrisburg,
PA*
|
MDT
|
San
Francisco, CA
|
SFO
|
|||
|
Houston,
TX
|
IAH
|
Seattle,
WA
|
SEA
|
|||
|
Huntsville,
AL*
|
HSV
|
St.
Louis, MO
|
STL
|
|||
|
Indianapolis,
IN
|
IND
|
Syracuse,
NY
|
SYR
|
|||
|
Jackson,
MS*
|
JAN
|
Tampa,
FL
|
TPA
|
|||
|
Jacksonville,
FL
|
JAX
|
Toledo,
OH*
|
TOL
|
|||
|
Kansas
City, MO
|
MCI
|
Tucson,
AZ*
|
TUS
|
|||
|
Knoxville,
TN*
|
TYS
|
Tulsa,
OK
|
TUL
|
|||
|
Lafayette,
LA*
|
LFT
|
Washington,
DC
|
IAD
|
|||
|
Laredo,
TX*
|
LRD
|
Montreal,
Canada*
|
YUL
|
|||
|
Las
Vegas, NV
|
LAS
|
Ottawa,
Canada*
|
YOW
|
|||
|
Little
Rock, AR
|
LIT
|
Toronto,
Canada
|
YYZ
|
|||
|
Los
Angeles, CA
|
LAX
|
|
*
|
Denotes
an independent agent location.
|
|
Year
|
Average
Weekly Volume in Pounds
|
|
(In
millions)
|
|
|
1990
|
1.2
|
|
1991
|
1.4
|
|
1992
|
2.3
|
|
1993
|
3.8
|
|
1994
|
7.4
|
|
1995
|
8.5
|
|
1996
|
10.5
|
|
1997
|
12.4
|
|
1998
|
15.4
|
|
1999
|
19.4
|
|
2000
|
24.0
|
|
2001
|
24.3
|
|
2002
|
24.5
|
|
2003
|
25.3
|
|
2004
|
28.7
|
|
2005
|
31.2
|
|
2006
|
32.2
|
|
•
|
exclusive-use
vehicles, commonly referred to as truck brokerage;
|
|
•
|
dedicated
fleets;
|
|
•
|
customs
brokerage, such as assistance with U.S. Customs and Border Protection
(“U.S. Customs”) procedures for both import and export shipments;
|
|
•
|
warehousing,
dock and office space; and
|
|
•
|
shipment
consolidation and handling, such as shipment build-up and break-down
and
reconsolidation of air or ocean pallets or containers.
|
|
Risk
Factors
|
|
•
|
identification
of appropriate acquisition candidates;
|
|
•
|
negotiation
of acquisitions on favorable terms and valuations;
|
|
•
|
integration
of acquired businesses and personnel;
|
|
•
|
implementation
of proper business and accounting controls;
|
|
•
|
ability
to obtain financing, on favorable terms or at all;
|
|
•
|
diversion
of management attention;
|
|
•
|
retention
of employees and customers; and
|
|
•
|
unexpected
liabilities.
|
| • |
authorize
us to issue preferred stock, the terms of which may be determined
at the
sole discretion of our Board of Directors and may adversely
affect the
voting or economic rights of our shareholders; and
|
| • |
establish
advance notice requirements for nominations for election to the Board
of
Directors and for proposing matters that can be acted
on
by shareholders at a meeting.
|
|
Unresolved
Staff Comments
|
|
Properties
|
|
Legal
Proceedings
|
|
Submission
of Matters to a Vote of Security Holders
|
|
Name
|
Age
|
Position
|
||
|
Bruce
A. Campbell
|
55
|
President
and Chief Executive Officer
|
||
|
Rodney
L. Bell
|
44
|
Chief
Financial Officer, Senior Vice President and Treasurer
|
||
|
Craig
A. Drum
|
51
|
Senior
Vice President, Sales
|
||
|
Matthew
J. Jewell
|
40
|
Senior
Vice President, General Counsel and Secretary
|
||
|
Chris
C. Ruble
|
44
|
Senior
Vice President, Operations
|
|
Market
for Registrant’s Common Equity, Related Shareholder Matters and Issuer
Purchases of Equity Securities
|
|
2006
|
High
|
Low
|
||
|
First
Quarter
|
$39.49
|
$31.01
|
||
|
Second
Quarter
|
$41.05
|
$35.04
|
||
|
Third
Quarter
|
$43.67
|
$30.26
|
||
|
Fourth
Quarter
|
$37.58
|
$28.86
|
||
|
2005
|
High
|
Low
|
||
|
First
Quarter
|
$30.37
|
$25.67
|
||
|
Second
Quarter
|
$30.00
|
$22.02
|
||
|
Third
Quarter
|
$36.86
|
$28.13
|
||
|
Fourth
Quarter
|
$40.93
|
$32.58
|
||
|
Plan
Category
|
Number
of Securities to be Issued upon Exercise of Outstanding Options,
Warrants
and Rights
|
Weighted-Average
Exercise Price of Outstanding Options, Warrants and
Rights
|
Number
of Securities Remaining Available for Future Issuance Under Equity
Compensation Plans (Excluding Securities Reflected in Column
(a))
|
|
||||||
|
(a)
|
(b)
|
|
(c)
|
|
||||||
|
Equity
Compensation Plans Approved by Shareholders
|
1,714,877
|
(1)
|
$
|
21.36
|
(2)
|
2,362,991
|
(3)
|
|||
|
Equity
Compensation Plans Not Approved by Shareholders
|
--
|
--
|
--
|
|||||||
|
Total
|
1,714,877
|
$
|
21.36
|
2,362,991
|
|
(1)
|
Includes 57,005
shares of Common Stock issuable upon the exercise of options under
the
1992 Plan. The 1992 Plan expired November 12, 2002. No additional
options
may be granted under the 1992 Plan.
|
|
(2)
|
Includes
the weighted-average exercise price of options outstanding under
the 1992
Plan. Excludes purchase rights accruing under the ESPP, which has
a
shareholder-approved reserve of 500,000 shares. Under the ESPP, each
eligible employee may purchase up to 2,000 shares of Common Stock
at
semi-annual intervals each year at a purchase price per share equal
to
90.0% of the lower of the fair market value of the Common Stock at
close
of (i) the first trading day of an option period or (ii) the last
trading
day of a option period.
|
|
(3)
|
Includes
shares available for future issuance under the ESPP. As of December
31,
2006, an aggregate of 479,079 shares of Common Stock were available
for
issuance under the ESPP.
|
|
|
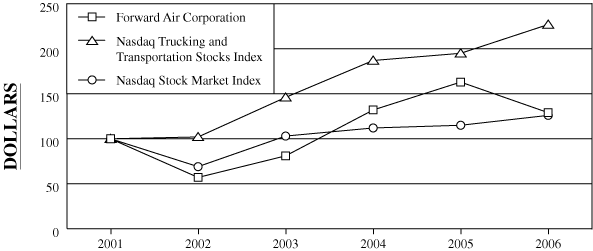
|
2001
|
|
2002
|
|
2003
|
|
2004
|
|
2005
|
|
2006
|
|
|
Forward
Air Corporation
|
|
$100
|
|
$
57
|
|
$
81
|
|
$132
|
|
$163
|
|
$129
|
|
|
NASDAQ
Trucking and Transportation Stocks Index
|
|
100
|
|
102
|
|
146
|
|
187
|
|
195
|
|
227
|
|
|
NASDAQ
Stock Market Index
|
|
100
|
|
69
|
|
103
|
|
112
|
|
115
|
|
126
|
|
|
Period
|
Total
Number of Shares Purchased
|
Average
Price Paid per Share
|
Total
Number of Shares Purchased as Part of Publicly Announced
Program
|
Maximum
Number of Shares that May Yet Be Purchased Under the Program
(1)
|
|
||||||||
|
--
|
--
|
--
|
--
|
||||||||||
|
November
1-30, 2006
|
--
|
--
|
--
|
--
|
|||||||||
|
December
1-31, 2006
|
100,000
|
$
|
29.48
|
1,386,673
|
1,613,327
|
||||||||
|
Total
|
100,000
|
$
|
29.48
|
1,386,673
|
1,613,327
|
|
(1)
|
On
November 17, 2005, we announced that our Board of Directors approved
a
stock repurchase program for up to 3.0 million shares of our Common
Stock
with a term expiring November 18,
2008.
|
|
Selected
Financial Data
|
|
|
Year
ended December 31
|
|||||||||||||||
|
2006
|
2005
|
2004
|
2003
|
2002
|
||||||||||||
|
(in
thousands, except per share data)
|
||||||||||||||||
|
Income
Statement Data:
|
||||||||||||||||
|
Operating
revenue
|
$
|
352,758
|
|
$
|
320,934
|
|
$
|
282,197
|
|
$
|
241,517
|
|
$
|
226,072
|
||
|
Income
from operations
|
75,396 |
67,437
|
53,598
|
40,182
|
32,737
|
|||||||||||
|
Operating
margin (1)
|
21.4 |
%
|
21.0
|
%
|
19.0
|
%
|
16.6
|
%
|
14.5
|
%
|
||||||
|
Net
income
|
48,923 |
44,909
|
34,421
|
25,815
|
21,616
|
|||||||||||
|
Net
income per share: (2)
|
||||||||||||||||
|
Basic
|
$
|
1.57
|
|
$
|
$1.41
|
|
$
|
1.07
|
|
$
|
0.81
|
|
$
|
0.67
|
||
|
Diluted
|
$
|
1.55 |
$
|
$1.39
|
|
$
|
1.05
|
|
$
|
0.79
|
|
$
|
0.65
|
|||
|
Cash
dividends declared per common share (2)
|
$
|
0.28
|
|
$
|
0.24
|
|
$
|
--
|
|
$
|
--
|
|
$
|
--
|
||
|
Balance
Sheet Data (at end of period):
|
||||||||||||||||
|
Total
assets
|
$
|
213,014
|
|
$
|
212,600
|
|
$
|
214,553
|
|
$
|
175,087
|
|
$
|
145,511
|
||
|
Long-term
obligations, net of current portion
|
796 |
837
|
867
|
907
|
935
|
|||||||||||
|
Shareholders’
equity
|
185,227 |
178,816
|
181,003
|
147,708
|
118,346
|
|||||||||||
|
(1)
|
Income
from operations as a percentage of operating revenue.
|
|
(2)
|
Restated
to reflect a three-for-two stock split declared in February 2005.
|
|
Management’s
Discussion and Analysis of Financial Condition and Results of Operations
|
|
|
2006
|
2005
|
Change
|
%
Change
|
|||||||||
|
Operating
revenue:
|
|||||||||||||
|
Airport-to-airport
|
$
|
299.6 |
$
|
276.9
|
$
|
22.7 | 8.2 | % | |||||
|
Logistics
|
32.1 | 24.4 | 7.7 | 31.6 | |||||||||
|
Accessorial
|
21.0 | 19.6 | 1.4 | 7.1 | |||||||||
|
Total
operating revenue
|
352.7 | 320.9 | 31.8 | 9.9 | |||||||||
|
Operating
expenses:
|
|||||||||||||
|
Purchased
transportation
|
146.7 | 132.9 | 13.8 | 10.4 | |||||||||
|
Salaries,
wages and employee benefits
|
74.4 | 68.1 | 6.3 | 9.3 | |||||||||
|
Operating
leases
|
14.5 | 13.5 | 1.0 |
7.4
|
|||||||||
|
Depreciation
and amortization
|
8.9 | 8.9 | -- | -- | |||||||||
|
Insurance
and claims
|
6.0 | 5.2 | 0.8 | 15.4 | |||||||||
|
Other
operating expenses
|
26.8 | 24.9 | 1.9 | 7.6 | |||||||||
|
Total
operating expenses
|
277.3 | 253.5 | 23.8 | 9.4 | |||||||||
|
Income
from operations
|
75.4 | 67.4 | 8.0 | 11.9 | |||||||||
|
Total
other income
|
3.1 | 3.8 | (0.7 | ) | (18.4 | ) | |||||||
|
Income
before income taxes
|
78.5 | 71.2 | 7.3 | 10.3 | |||||||||
|
Income
taxes
|
29.6 | 26.3 | 3.3 | 12.5 | |||||||||
|
Net
income
|
$
|
48.9 |
$
|
44.9
|
$
|
4.0 | 8.9 |
%
|
|
|
2005
|
|
|
2004
|
|
|
Change
|
|
|
%
Change
|
|||
|
Operating
revenue:
|
|||||||||||||
|
Airport-to-airport
|
$
|
276.9 |
$
|
238.4
|
$
|
38.5 | 16.1 |
%
|
|||||
|
Logistics
|
24.4 | 24.1 | 0.3 | 1.2 | |||||||||
|
Accessorial
|
19.6 | 19.7 | (0.1 | ) | (0.5 | ) | |||||||
|
Total
operating revenue
|
320.9 | 282.2 | 38.7 | 13.7 | |||||||||
|
Operating
expenses:
|
|||||||||||||
|
Purchased
transportation
|
132.9 | 118.4 | 14.5 | 12.2 | |||||||||
|
Salaries,
wages and employee benefits
|
68.1 | 62.7 | 5.4 | 8.6 | |||||||||
|
Operating
leases
|
13.5 | 12.8 | 0.7 | 5.5 | |||||||||
|
Depreciation
and amortization
|
8.9 | 6.8 | 2.1 | 30.9 | |||||||||
|
Insurance
and claims
|
5.2 | 5.4 | (0.2 | ) | (3.7 | ) | |||||||
|
Other
operating expenses
|
24.9 | 22.5 | 2.4 | 10.7 | |||||||||
|
Total
operating expenses
|
253.5 | 228.6 | 24.9 | 10.9 | |||||||||
|
Income
from operations
|
67.4 | 53.6 | 13.8 | 25.7 | |||||||||
|
Total
other income
|
3.8 | 1.1 | 2.7 | 245.5 | |||||||||
|
Income
before income taxes
|
71.2 | 54.7 | 16.5 | 30.2 | |||||||||
|
Income
taxes
|
26.3 | 20.3 | 6.0 | 29.6 | |||||||||
|
Net
income
|
$
|
44.9 |
$
|
34.4
|
$
|
10.5 | 30.5 |
%
|
|
2006
|
|
|
2005
|
|
|
2004
|
||||
|
Operating
revenue:
|
|
|
|
|
|
|
||||
|
Airport-to-airport
|
84.9 | 86.3 | % | 84.5 | % | |||||
|
Logistics
|
9.1 | 7.6 | 8.5 | |||||||
|
Accessorial
|
6.0 | 6.1 | 7.0 | |||||||
|
Total
operating revenue
|
100.0 | % | 100.0 | % | 100.0 | % | ||||
|
Operating
expenses:
|
||||||||||
|
Purchased
transportation
|
41.6 |
41.4
|
42.0
|
|||||||
|
Salaries,
wages and employee benefits
|
21.1
|
21.2
|
22.2
|
|||||||
|
Operating
leases
|
4.1
|
4.2
|
4.5
|
|||||||
|
Depreciation
and amortization
|
2.5
|
2.8
|
2.4
|
|||||||
|
Insurance
and claims
|
1.7
|
1.6
|
1.9
|
|||||||
|
Other
operating expenses
|
7.6
|
7.8
|
8.0
|
|||||||
|
Total
operating expenses
|
78.6
|
79.0
|
81.0
|
|||||||
|
Income
from operations
|
21.4
|
21.0
|
19.0
|
|||||||
|
Other
income, net
|
0.9
|
1.2
|
0.4
|
|||||||
|
Income
before income taxes
|
22.3
|
22.2
|
19.4
|
|||||||
|
Income
taxes
|
8.4
|
8.2
|
7.2
|
|||||||
|
Net
income
|
13.9 | % |
14.0
|
%
|
12.2
|
%
|
|
Contractual
Obligations
|
Payment
Due Period
|
|||||||||||||||
|
Total
|
Less
Than 1 Year
|
2-3
Years
|
|
|
4-5
Years
|
|
|
After
5 Years
|
||||||||
|
Capital
lease obligations
|
$
|
1,217 |
$
|
89
|
$
|
178
|
$
|
178
|
$
|
772
|
||||||
| Real estate purchase commitments |
32,088
|
32,088
|
--
|
--
|
--
|
|||||||||||
|
Operating
leases
|
28,698
|
11,127
|
13,248
|
4,224
|
99
|
|||||||||||
|
Total
contractual cash obligations
|
$
|
62,003
|
$
|
43,304
|
$
|
13,426
|
$
|
4,402
|
$
|
871
|
||||||
|
Quantitative
and Qualitative Disclosures About Market Risk
|
|
Financial
Statements and Supplementary Data
|
|
Changes
in and Disagreements with Accountants on Accounting and Financial
Disclosure
|
|
Controls
and Procedures
|
|
/s/
Ernst & Young LLP
|
|
|
Nashville,
Tennessee
|
|
|
February
26, 2007
|
|
Other
Information
|
|
Directors,
Executive Officers and Corporate Governance
|
|
Executive
Compensation
|
|
Security
Ownership of Certain Beneficial Owners and Management and Related
Shareholder Matters
|
|
Certain
Relationships and Related Transactions, and Director
Independence
|
|
Principal
Accounting Fees and Services
|
|
Exhibits,
Financial Statement
Schedules
|
|
(a)(1)
and (2)
|
List
of Financial Statements and Financial Statement
Schedules.
|
|
(a)(3)
|
List
of Exhibits.
|
|
(b)
|
Exhibits.
|
|
(c)
|
Financial
Statement Schedules.
|
|
|
|
Forward
Air Corporation
|
|
|
Date:
February 27, 2007
|
|
By:
|
/s/
Bruce A. Campbell
|
|
|
|
|
Bruce
A. Campbell
President
and Chief Executive Officer
|
|
Signature
|
|
Title
|
|
Date
|
|
|
|
|
|
|
|
|
|
|
|
|
|
/s/
Richard W. Hanselman
|
|
Chairman
of the Board
|
|
February
27, 2007
|
|
Richard
W. Hanselman
|
|
|
|
|
|
|
|
|
|
|
|
|
|
|
|
|
|
/s/
Bruce A. Campbell
|
|
President,
Chief Executive Officer
|
|
February
27, 2007
|
|
Bruce
A. Campbell
|
|
and
Director
|
|
|
|
|
|
(Principal
Executive Officer)
|
|
|
|
|
|
|
|
|
|
/s/
Rodney L. Bell
|
|
Chief
Financial Officer, Senior Vice
|
|
February
27, 2007
|
|
Rodney
L. Bell
|
|
President
and Treasurer
|
|
|
|
|
|
(Principal
Financial and Accounting Officer)
|
|
|
|
|
|
|
|
|
|
/s/
C. Robert Campbell
|
|
Director
|
|
February
27, 2007
|
|
C.
Robert Campbell
|
|
|
|
|
|
|
|
|
|
|
|
|
|
|
|
|
|
/s/
C. John Langley, Jr.
|
|
Director
|
|
February
27, 2007
|
|
C.
John Langley, Jr.
|
|
|
|
|
|
|
|
|
|
|
|
|
|
|
|
|
|
/s/
G. Michael Lynch
|
|
Director
|
|
February
27, 2007
|
|
G.
Michael Lynch
|
|
|
|
|
|
|
|
|
|
|
|
|
|
|
|
|
|
/s/
Ray A. Mundy
|
|
Director
|
|
February
27, 2007
|
|
Ray
A. Mundy
|
|
|
|
|
|
|
|
|
|
|
|
|
|
|
|
|
|
/s/
B. Clyde Preslar
|
|
Director
|
|
February
27, 2007
|
|
B.
Clyde Preslar
|
|
|
|
|
|
Page
No.
|
|
|
F-3
|
|
|
F-4
|
|
|
F-6
|
|
|
F-7
|
|
|
F-8
|
|
|
F-9
|
|
/s/
Ernst & Young LLP
|
|
|
Nashville,
Tennessee
|
|
|
February
26, 2007
|
|
December
31
|
|||||||
|
2006
|
|
|
2005
|
||||
|
(In
thousands, except share data)
|
|||||||
|
Assets
|
|||||||
|
Current
assets:
|
|||||||
|
Cash
|
$
|
8,231
|
$
|
332
|
|||
|
Short-term
investments
|
61,650
|
79,000
|
|||||
|
Accounts
receivable, less allowances of $860 in 2006 and $922 in
2005
|
48,486
|
45,763
|
|||||
|
Income
taxes receivable
|
3,403
|
5,179
|
|||||
|
Inventories
|
501
|
567
|
|||||
|
Prepaid
expenses and other current assets
|
4,114
|
4,455
|
|||||
|
Deferred
income taxes
|
1,178
|
1,438
|
|||||
|
Total
current assets
|
127,563
|
136,734
|
|||||
|
Property
and equipment:
|
|||||||
|
Land
|
2,611
|
2,611
|
|||||
|
Buildings
|
12,367
|
8,051
|
|||||
|
Equipment
|
82,646
|
77,165
|
|||||
|
Leasehold
improvements
|
3,566
|
3,259
|
|||||
|
Total
property and equipment
|
101,190
|
91,086
|
|||||
|
Accumulated
depreciation and amortization
|
47,875
|
43,864
|
|||||
|
Net
property and equipment
|
53,315
|
47,222
|
|||||
|
Goodwill
and other acquired intangibles:
|
|||||||
|
Goodwill
|
15,588
|
15,588
|
|||||
|
Other
acquired intangibles, net of accumulated amortization of $2,019 in
2006
and $744 in 2005
|
10,731
|
12,007
|
|||||
|
Total
net goodwill and other acquired intangibles
|
26,319
|
27,595
|
|||||
|
Other
assets
|
5,817
|
1,049
|
|||||
|
Total
assets
|
$
|
213,014
|
$
|
212,600
|
|||
|
December
31
|
|||||||
|
2006
|
|
|
2005
|
||||
|
(In
thousands, except share data)
|
|||||||
|
Liabilities
and shareholders’ equity
|
|||||||
|
Current
liabilities:
|
|||||||
|
Accounts
payable
|
$
|
7,949
|
$
|
12,640
|
|||
|
Accrued
payroll and related items
|
3,117
|
|
3,262
|
||||
|
Insurance
and claims accruals
|
3,265 |
4,381
|
|||||
|
Payables
to owner-operators
|
2,128 | 1,779 | |||||
|
Collections
on behalf of customers
|
1,347 | 1,572 | |||||
|
Other
accrued expenses
|
1,287
|
788
|
|||||
|
Short-term
debt
|
--
|
1,504
|
|||||
|
Current
portion of capital lease obligations
|
40
|
38
|
|||||
|
Total
current liabilities
|
19,133
|
25,964
|
|||||
|
Capital
lease obligations, less current portion
|
796
|
837
|
|||||
| Other long-term liabilities | 1,271 |
--
|
|||||
|
Deferred
income taxes
|
6,587
|
6,983
|
|||||
| Commitments and contingencies (Note 9) | |||||||
|
Shareholders’
equity:
|
|||||||
|
Preferred
stock, $0.01 par value:
|
|||||||
|
Authorized
shares - 5,000,000
|
|||||||
|
No
shares issued
|
--
|
--
|
|||||
|
Common
stock, $0.01 par value:
|
|||||||
|
Authorized
shares - 50,000,000
|
|||||||
|
Issued
and outstanding shares - 30,372,082 in 2006 and 31,360,842 in
2005
|
304
|
314
|
|||||
|
Additional
paid-in capital
|
--
|
--
|
|||||
|
Accumulated
other comprehensive income
|
--
|
--
|
|||||
|
Retained
earnings
|
184,923
|
178,502
|
|||||
|
Total
shareholders’ equity
|
185,227
|
178,816
|
|||||
|
Total
liabilities and shareholders’ equity
|
$
|
213,014
|
$
|
212,600
|
|||
|
Year
ended December 31
|
||||||||||
|
2006
|
|
|
2005
|
|
|
2004
|
||||
|
(In
thousands, except per share data)
|
||||||||||
|
Operating
revenue
|
$
|
352,758
|
$
|
320,934
|
$
|
282,197
|
||||
|
Operating
expenses:
|
||||||||||
|
Purchased
transportation
|
146,721
|
132,912
|
118,425
|
|||||||
|
Salaries,
wages and employee benefits
|
74,448
|
68,086
|
62,728
|
|||||||
|
Operating
leases
|
14,458
|
13,486
|
12,791
|
|||||||
|
Depreciation
and amortization
|
8,934
|
8,947
|
6,817
|
|||||||
|
Insurance
and claims
|
5,967
|
5,202
|
5,382
|
|||||||
|
Other
operating expenses
|
26,834
|
24,864
|
22,456
|
|||||||
|
Total
operating expenses
|
277,362
|
253,497
|
228,599
|
|||||||
|
Income
from operations
|
75,396
|
67,437
|
53,598
|
|||||||
|
Other
income (expense):
|
||||||||||
|
Interest
expense
|
(81
|
)
|
(104
|
)
|
(55
|
)
|
||||
|
Other,
net
|
3,229
|
3,904
|
1,127
|
|||||||
|
Total
other income
|
3,148
|
3,800
|
1,072
|
|||||||
|
Income
before income taxes
|
78,544
|
71,237
|
54,670
|
|||||||
|
Income
taxes
|
29,621
|
26,328
|
20,249
|
|||||||
|
Net
income
|
$
|
48,923
|
$
|
44,909
|
$
|
34,421
|
||||
|
Income
per share:
|
||||||||||
|
Basic
|
$
|
1.57
|
$
|
1.41
|
$
|
1.07
|
||||
|
Diluted
|
$
|
1.55
|
$
|
1.39
|
$
|
1.05
|
||||
|
Dividends
declared per share
|
$
|
0.28
|
$
|
0.24
|
$
|
--
|
||||
|
Common
Stock
|
Additional
Paid-in Capital
|
Retained
Earnings
|
Accumulated
Other Comprehensive Income
(Loss)
|
Total
Shareholders’ Equity
|
|||||||||||||||
|
Shares
|
Amount
|
||||||||||||||||||
|
(In
thousands)
|
|||||||||||||||||||
|
Balance
at December 31, 2003
|
32,245
|
$
|
322
|
$
|
37,410
|
$
|
109,975
|
$
|
1
|
$
|
147,708
|
||||||||
|
Net
income for 2004
|
--
|
--
|
--
|
34,421
|
--
|
34,421
|
|||||||||||||
|
Unrealized
gain on securities available for sale, net of $2 tax
|
--
|
--
|
--
|
--
|
3
|
3
|
|||||||||||||
|
Comprehensive
income
|
34,424
|
||||||||||||||||||
|
Exercise
of stock options
|
588
|
6
|
7,097
|
--
|
--
|
7,103
|
|||||||||||||
|
Common
stock issued under employee stock purchase plan
|
14
|
--
|
250
|
--
|
--
|
250
|
|||||||||||||
|
Common
stock repurchased under stock repurchase plan
|
(449
|
)
|
(4
|
)
|
(11,384
|
)
|
--
|
--
|
(11,388
|
)
|
|||||||||
|
Income
tax benefit from stock options exercised
|
--
|
--
|
2,906
|
--
|
--
|
2,906
|
|||||||||||||
|
Balance
at December 31, 2004
|
32,398
|
324
|
36,279
|
144,396
|
4
|
181,003
|
|||||||||||||
|
Net
income for 2005
|
--
|
--
|
--
|
44,909
|
--
|
44,909
|
|||||||||||||
|
Unrealized
loss on securities available for sale, net of ($2) tax
|
--
|
--
|
--
|
--
|
(4
|
)
|
(4
|
)
|
|||||||||||
|
Comprehensive
income
|
44,905
|
||||||||||||||||||
|
Exercise
of stock options
|
643
|
6
|
6,206
|
--
|
--
|
6,212
|
|||||||||||||
|
Common
stock issued under employee stock purchase plan
|
11
|
1
|
293
|
--
|
--
|
294
|
|||||||||||||
|
Acceleration
of vesting of stock options
|
--
|
--
|
1,300
|
--
|
--
|
1,300
|
|||||||||||||
|
Dividends
($0.24 per share)
|
--
|
--
|
--
|
(7,668
|
)
|
--
|
(7,668
|
)
|
|||||||||||
|
Common
stock repurchased under stock repurchase plan
|
(1,690
|
)
|
(17
|
)
|
(49,108
|
)
|
(3,135
|
)
|
--
|
(52,260
|
)
|
||||||||
|
Cash
paid for fractional shares in 3-for-2 stock split
|
(1
|
)
|
--
|
(44
|
)
|
--
|
--
|
(44
|
)
|
||||||||||
|
Income
tax benefit from stock options exercised
|
--
|
--
|
5,074
|
--
|
--
|
5,074
|
|||||||||||||
|
Balance
at December 31, 2005
|
31,361
|
|
|
314
|
|
|
--
|
|
|
178,502
|
|
|
--
|
|
|
178,816
|
|||
|
Net
and comprehensive income for 2006
|
--
|
--
|
--
|
48,923 |
--
|
48,923 | |||||||||||||
|
Exercise
of stock options
|
305 | 3 | 4,359 |
--
|
--
|
4,362 | |||||||||||||
|
Common
stock issued under employee stock purchase plan
|
9 |
--
|
268 |
--
|
--
|
268 | |||||||||||||
|
Share-based
compensation
|
--
|
--
|
1,307 |
--
|
--
|
1,307 | |||||||||||||
|
Dividends
($0.28 per share)
|
--
|
--
|
--
|
(8,694 | ) |
--
|
(8,694 | ) | |||||||||||
|
Common
stock repurchased under stock repurchase plan
|
(1,303 | ) | (13 | ) |
(7,901
|
) | (33,808 | ) | -- | (41,722 | ) | ||||||||
|
Income
tax benefit from stock options exercised
|
--
|
--
|
1,967
|
--
|
-- | 1,967 | |||||||||||||
|
Balance
at December 31, 2006
|
30,372 |
$
|
304 |
$
|
-- |
$
|
184,923 |
$
|
-- |
$
|
185,227 | ||||||||
|
Year
ended December 31
|
||||||||||
|
2006
|
|
|
2005
|
|
|
2004
|
||||
|
(In
thousands)
|
||||||||||
|
Operating
activities:
|
||||||||||
|
Net
income
|
$
|
48,923
|
|
$
|
44,909
|
|
$
|
34,421
|
||
|
Adjustments
to reconcile net income to net cash provided by operating
activities:
|
||||||||||
|
Depreciation
and amortization
|
8,934
|
8,947
|
6,817
|
|||||||
|
Share-based
compensation
|
1,307 | 1,300 | -- | |||||||
|
Atlanta
condemnation settlement gain
|
--
|
|
(1,428
|
) |
--
|
|||||
|
Other
non-cash charges
|
--
|
274
|
--
|
|||||||
|
Gain
on sale of property and equipment
|
(42
|
)
|
(728
|
) |
--
|
|||||
|
Provision
for (recovery) loss on receivables
|
(223
|
)
|
(121
|
)
|
161
|
|||||
|
Provision
for revenue adjustments
|
2,095
|
2,100
|
1,848
|
|||||||
|
Deferred
income taxes
|
(136
|
)
|
(48
|
)
|
1,511
|
|
||||
|
Tax
benefit of stock options exercised
|
(1,967 | ) |
5,074
|
2,906
|
||||||
|
Changes
in operating assets and liabilities:
|
||||||||||
|
Accounts
receivable
|
(6,516
|
)
|
(7,438
|
)
|
(8,886
|
)
|
||||
|
Inventories
|
66
|
|
(145
|
)
|
(23
|
) | ||||
|
Prepaid
expenses and other current assets
|
341
|
|
(705
|
)
|
(1,081
|
)
|
||||
|
Accounts
payable and accrued expenses
|
(4,058
|
) |
615
|
4,262
|
||||||
|
Income
taxes
|
3,743
|
|
(1,374
|
)
|
(4,521
|
) | ||||
|
Net
cash provided by operating activities
|
52,467
|
51,232
|
37,415
|
|||||||
|
Investing
activities:
|
||||||||||
|
Proceeds
from disposal of property and equipment
|
3,665 |
2,804
|
9
|
|||||||
|
Purchases
of property and equipment
|
(15,454 |
)
|
(22,077
|
)
|
(11,200
|
)
|
||||
| Deposits in escrow for construction of new terminals | (4,793 |
)
|
-- | -- | ||||||
|
Proceeds
from sales or maturities of available-for-sale securities
|
229,330
|
229,865
|
232,496
|
|||||||
|
Purchases
of available-for-sale securities
|
(211,980
|
)
|
(197,265
|
)
|
(273,916
|
)
|
||||
|
Acquisition
of business
|
-- |
|
(12,750
|
) |
--
|
|||||
|
Proceeds
from Atlanta condemnation settlement/release of amounts held in
escrow
|
--
|
2,765
|
1,260
|
|||||||
|
Other
|
26
|
|
(242
|
)
|
(94
|
) | ||||
|
Net
cash provided by (used in) investing activities
|
794
|
3,100
|
|
(51,445
|
)
|
|||||
|
Financing
activities:
|
||||||||||
| Payments of capital lease obligations | (39 |
)
|
(31
|
)
|
(30
|
)
|
||||
| (Payments) borrowings on line of credit | (1,504 | ) |
1,504
|
-- | ||||||
|
Proceeds
from exercise of stock options
|
4,362
|
5,938
|
7,103
|
|||||||
|
Payments
of cash dividends
|
(8,694 |
)
|
(7,668
|
)
|
--
|
|||||
|
Cash
paid for fractional shares in 3-for-2 stock split
|
-- |
(44
|
)
|
--
|
||||||
|
Proceeds
from common stock issued under employee stock purchase plan
|
268 | 294 |
250
|
|||||||
|
Repurchase
of common stock
|
(41,722 |
)
|
(54,071
|
)
|
(9,577
|
)
|
||||
| Tax benefit of stock options exercised | 1,967 | -- | -- | |||||||
|
Net
cash used in financing activities
|
(45,362
|
)
|
(54,078
|
)
|
(2,254
|
)
|
||||
|
Net
increase (decrease) in cash
|
7,899
|
254
|
|
(16,284
|
) | |||||
|
Cash
at beginning of year
|
332 |
78
|
16,362
|
|||||||
|
Cash
at end of year
|
$
|
8,231
|
|
$
|
332
|
|
$
|
78
|
||
|
Common
stock repurchase liabilities included in accounts payable
|
$
|
-- |
|
$
|
--
|
|
$
|
1,811
|
|
|
|
Uncollected
proceeds from disposal of property and equipment in accounts
receivable
|
$
|
49 |
$
|
1,970 |
$
|
-- | ||||
|
1.
|
Accounting
Policies
|
|
1.
|
Accounting
Policies (Continued)
|
|
Buildings
|
30-40
years
|
|
Equipment
|
3-10
years
|
|
Leasehold
improvements
|
Lesser
of Useful Life or Initial Lease
Term
|
|
1.
|
Accounting
Policies
(Continued)
|
|
1.
|
Accounting
Policies (Continued)
|
|
1.
|
Accounting
Policies (Continued)
|
|
|
2005
|
2004
|
|||||
|
Net
income, as reported
|
$
|
44,909
|
$
|
34,421
|
|||
|
Pro
forma compensation expense, net of tax
|
(12,579
|
)
|
(2,658
|
)
|
|||
|
Pro
forma net income
|
$
|
32,330
|
$
|
31,763
|
|||
|
Pro
forma net income per share:
|
|||||||
|
Basic
|
$
|
1.02
|
$
|
0.98
|
|||
|
Diluted
|
$
|
1.00
|
$
|
0.96
|
|
2.
|
Acquisition
of Business
|
|
3.
|
Investments
|
|
|
Amortized
Cost
|
Gross
Unrealized Gains
|
Gross
Unrealized Losses
|
Fair
Value
|
|||||||||
|
December
31, 2006
|
|||||||||||||
|
Available-for-sale
securities
|
$
|
61,650
|
|
$
|
--
|
|
$
|
--
|
|
$
|
61,650
|
|
|
|
December
31, 2005
|
|||||||||||||
|
Available-for-sale
securities
|
$
|
78,999
|
|
$
|
1
|
|
$
|
--
|
|
$
|
79,000
|
|
|
3.
|
Investments
(Continued)
|
|
Cost
|
Fair
Value
|
||||||
|
Debt
securities:
|
|||||||
|
Contractual
maturity within one year
|
$
|
--
|
|
$
|
--
|
|
|
|
Contractual
maturity after one year through five years
|
8,400
|
8,400
|
|||||
|
Contractual
maturity after five years through ten years
|
700
|
700
|
|||||
|
Contractual
maturity after ten years
|
52,550
|
52,550
|
|||||
|
Total
debt securities with contractual maturities
|
$
|
61,650
|
|
$
|
61,650
|
|
|
4.
|
Credit
Facilities and Long-Term Debt
|
|
5.
|
Shareholders’
Equity and Stock Options
|
|
5.
|
Shareholders’
Equity and Stock Options
(Continued)
|
|
2006
|
2005
|
2004
|
|||||||||||||||||
|
Options
(000)
|
Weighted-Average
Exercise Price
|
Options
(000)
|
|
Weighted-Average
Exercise Price
|
Options
(000)
|
|
Weighted-Average
Exercise Price
|
||||||||||||
|
Outstanding
at beginning of year
|
1,957
|
$
|
23
|
|
|
1,443
|
|
$
|
15
|
|
|
1,476
|
|
$
|
15
|
||||
|
Granted/converted
|
--
|
--
|
985
|
29
|
326
|
19
|
|||||||||||||
|
Exercised
|
(476
|
)
|
23
|
(443
|
)
|
9 |
(333
|
)
|
17
|
||||||||||
|
Forfeited
|
(6
|
)
|
34
|
(28
|
)
|
22 |
(26
|
)
|
19
|
||||||||||
|
Outstanding
at end of year
|
|
1,475
|
|
$
|
23
|
|
|
1,957
|
|
$
|
23
|
|
|
1,443
|
|
$
|
15
|
|
|
|
Exercisable
at end of year
|
|
1,475
|
|
$
|
23
|
|
|
1,957
|
|
$
|
23
|
|
|
783
|
|
$
|
12
|
|
|
|
Options
available for grant
|
1,192
|
1,315
|
2,273
|
||||||||||||||||
| Average aggregate intrinsic value |
$
|
18,381 |
|
||||||||||||||||
|
Weighted-average
fair value of options granted during the year
|
$
|
--
|
|
|
|
|
$
|
12.79
|
|
|
|
|
$
|
9.49
|
|
|
|
||
|
Range
of Exercise Price
|
Number
Outstanding (000)
|
|
Weighted-Average
Remaining Contractual Life
|
Weighted-Average
Exercise Price
|
Number
Exercisable (000)
|
|
Weighted-Average
Exercise Price
|
||||||||||
|
$
|
4.17 —
4.95
|
68
|
|
2.0
years
|
$
|
4 |
|
68
|
|
|
$
|
4
|
|
||||
|
|
11.33 —
15.87
|
226
|
|
5.9 years
|
14
|
226
|
|
14
|
|||||||||
|
17.60
— 24.94
|
402
|
|
6.0
years
|
20 |
402
|
|
20
|
||||||||||
|
28.97
— 32.46
|
779
|
8.1 years
|
29 |
779
|
29 | ||||||||||||
|
$
|
4.17
—
32.46
|
1,475
|
|
6.9 years
|
$
|
23
|
|
1,475
|
|
|
$
|
23
|
|
||||
|
5.
|
Shareholders’
Equity and Stock Options
(Continued)
|
|
5.
|
Shareholders’
Equity and Stock Options
(Continued)
|
|
2006
|
2005
|
2004
|
||||||||
|
Numerator:
|
||||||||||
|
Numerator
for income per basic and diluted share - net income
|
$
|
48,923
|
|
$
|
44,909
|
|
$
|
34,421
|
||
|
Denominator:
|
||||||||||
|
Denominator
for income per basic share - weighted-average shares (in
thousands)
|
31,091
|
31,847
|
32,310
|
|||||||
|
Effect
of dilutive stock options and non-vested shares (in
thousands)
|
430
|
572
|
630
|
|||||||
|
Denominator
for income per diluted share - adjusted weighted-average shares (in
thousands)
|
31,521
|
32,419
|
32,940
|
|||||||
|
Income
per basic share
|
$
|
1.57
|
|
$
|
1.41
|
|
$
|
1.07
|
||
|
Income
per diluted share
|
$
|
1.55
|
|
$
|
1.39
|
|
$
|
1.05
|
|
|
6.
|
Income
Taxes
|
|
2006
|
|
|
2005
|
|
|
2004
|
||||
|
Current:
|
||||||||||
|
Federal
|
$
|
25,663
|
|
$
|
22,706
|
|
$
|
16,598
|
||
|
State
|
4,094
|
3,670
|
2,140
|
|||||||
|
29,757
|
26,376
|
18,738
|
||||||||
|
Deferred:
|
||||||||||
|
Federal
|
(57
|
)
|
(50
|
) |
1,224
|
|
||||
|
State
|
(79 | ) |
2
|
287
|
|
|||||
|
(136
|
)
|
(48
|
) |
1,511
|
|
|||||
|
$
|
29,621
|
|
$
|
26,328
|
|
$
|
20,249
|
|
6.
|
Income
Taxes (Continued)
|
|
2006
|
|
|
2005
|
|
|
2004
|
||||
|
Tax
expense at the statutory rate
|
$
|
27,490
|
|
$
|
24,933
|
|
$
|
19,134
|
||
|
State
income taxes, net of federal benefit
|
2,839
|
2,386
|
1,578
|
|||||||
|
Meals
and entertainment
|
233
|
207
|
195
|
|||||||
|
Tax-exempt
interest income
|
(1,005
|
)
|
(872
|
)
|
(419
|
)
|
||||
|
Other
|
64
|
|
(326
|
)
|
(239
|
)
|
||||
|
$
|
29,621
|
|
$
|
26,328
|
|
$
|
20,249
|
|
December
31
|
|||||||
|
2006
|
|
|
2005
|
||||
|
Deferred
tax assets:
|
|||||||
|
Accrued
expenses
|
$
|
1,917
|
|
$
|
2,032
|
|
|
|
Allowance
for doubtful accounts
|
351
|
353
|
|||||
|
Non-compete
agreements
|
260 |
95
|
|||||
|
Acceleration
of option vesting
|
854
|
476
|
|||||
|
Net
operating loss carryforwards
|
408
|
530
|
|||||
|
Total
deferred tax assets
|
3,790
|
3,486
|
|||||
|
Valuation
allowance
|
(408 |
)
|
(408
|
)
|
|||
|
Total
deferred tax assets, net of valuation allowance
|
3,382
|
3,078
|
|||||
|
Deferred
tax liabilities:
|
|||||||
|
Tax
over book depreciation
|
5,943
|
6,054
|
|||||
|
Research
and development expenses
|
12
|
180
|
|||||
|
Prepaid
expenses deductible when paid
|
1,090 |
948
|
|||||
|
Other
|
1,746
|
1,441
|
|||||
|
Total
deferred tax liabilities
|
8,791
|
8,623
|
|||||
|
Net
deferred tax liabilities
|
$
|
(5,409
|
)
|
$
|
(5,545
|
)
|
|
|
December
31
|
|||||||
|
2006
|
|
|
2005
|
||||
|
Current
assets
|
$
|
1,178
|
|
$
|
1,438
|
||
|
Noncurrent
liabilities
|
(6,587
|
)
|
(6,983
|
)
|
|||
|
$
|
(5,409
|
)
|
$
|
(5,545
|
)
|
||
|
6.
|
Income
Taxes (Continued)
|
|
7.
|
Leases
|
|
December
31
|
|||||||
|
2006
|
|
|
2005
|
||||
|
Buildings
|
$
|
3,015
|
|
$
|
3,015
|
||
|
Less
accumulated amortization
|
1,066
|
888
|
|||||
|
$
|
1,949
|
|
$
|
2,127
|
|||
|
7.
|
Leases
(Continued)
|
|
|
Capital
Leases
|
Operating
Leases
|
||||||
|
Fiscal
Year
|
||||||||
|
2007
|
$
|
89
|
$
|
11,127
|
||||
|
2008
|
89
|
8,197
|
||||||
|
2009
|
89
|
5,051
|
||||||
|
2010
|
89
|
2,977
|
||||||
|
2011
|
89
|
1,247
|
||||||
|
Thereafter
|
772
|
99
|
||||||
|
Total
minimum lease payments
|
$
|
1,217
|
|
$
|
28,698
|
|||
|
Amounts
representing interest
|
381
|
|||||||
|
Present
value of net minimum lease payments
(including
current portion of $40)
|
$
|
836
|
||||||
|
8.
|
Transactions
With Related Parties
|
|
9.
|
Commitments
and Contingencies
|
|
9.
|
Commitments
and Contingencies
(Continued)
|
|
10.
|
Employee
Benefit Plan
|
|
11.
|
Financial
Instruments
|
|
11.
|
Financial
Instruments
(Continued)
|
|
12.
|
Subsequent
Event
|
|
13.
|
Quarterly
Results of Operations (Unaudited)
|
|
2006
|
|||||||||||||
|
|
March
31
|
June
30
|
|
|
September
30
|
|
|
December
31
|
|||||
|
Operating
revenue
|
$
|
82,330
|
|
$
|
86,779
|
|
$
|
90,441
|
|
$
|
93,208
|
|
|
|
Income
from operations
|
16,956
|
19,767
|
19,788
|
18,885
|
|||||||||
|
Net
income
|
11,008
|
13,021
|
12,725
|
12,169
|
|||||||||
|
Net
income per share:
|
|||||||||||||
|
Basic
|
$
|
0.35
|
|
$
|
0.41
|
|
$
|
0.41
|
|
$
|
0.40
|
|
|
|
Diluted
|
$
|
0.35
|
|
$
|
0.41
|
|
$
|
0.41
|
|
$
|
0.40
|
|
|
|
2005
|
|||||||||||||
|
|
March
31
|
June
30
|
|
|
September
30
|
|
|
December
31
|
|||||
|
Operating
revenue
|
$
|
69,533
|
|
$
|
77,488
|
|
$
|
84,841
|
|
$
|
89,072
|
||
|
Income
from operations
|
13,381
|
16,791
|
18,669
|
18,595
|
|||||||||
|
Net
income
|
8,693
|
11,954
|
12,065
|
12,197
|
|||||||||
|
Net
income per share:
|
|||||||||||||
|
Basic
|
$
|
0.27
|
|
$
|
0.37
|
|
$
|
0.38
|
|
$
|
0.39
|
||
|
Diluted
|
$
|
0.27
|
|
$
|
0.37
|
|
$
|
0.38
|
|
$
|
0.38
|
||
|
Col.
A
|
Col.
B
|
Col.
C
|
Col.
D
|
|
|
Col.
E
|
|
|||||||||
|
Additions
|
||||||||||||||||
|
Description
|
Balance
at Beginning of Period
|
(1)
Charged
to Costs and Expenses
|
(2)
Charged
to Other Accounts-Describe
|
Deductions-Describe
|
Balance
at End of Period
|
|||||||||||
|
(In
thousands)
|
||||||||||||||||
| Year ended December 31, 2006: | ||||||||||||||||
|
Allowance
for doubtful accounts
|
$
|
637 |
$
|
(223
|
) |
$
|
--
|
$
|
(210
|
)(2) |
$
|
624
|
||||
|
Allowance
for revenue adjustments
(1)
|
285 |
2,095
|
--
|
2,144
|
(3) |
236
|
||||||||||
| 922 |
1,872
|
--
|
1,934
|
860
|
||||||||||||
|
Year
ended December 31, 2005:
|
||||||||||||||||
|
Allowance
for doubtful accounts
|
$
|
826
|
$
|
(121
|
)
|
$
|
--
|
$
|
68
|
(2)
|
$
|
637
|
||||
|
Allowance
for revenue adjustments
(1)
|
246
|
2,100
|
--
|
2,061
|
(3)
|
285
|
||||||||||
|
1,072
|
1,979
|
--
|
2,129
|
922
|
||||||||||||
|
Year
ended December 31, 2004:
|
||||||||||||||||
|
Allowance
for doubtful accounts
|
$
|
943
|
$
|
161
|
$
|
--
|
$
|
278
|
(2)
|
$
|
826
|
|||||
|
Allowance
for revenue adjustments
(2)
|
320
|
1,848
|
--
|
1,922
|
(3)
|
246
|
||||||||||
|
1,263
|
2,009
|
--
|
2,200
|
1,072
|
||||||||||||
|
(1)
|
Represents
an allowance for adjustments to accounts receivable due to disputed
rates,
accessorial charges and other aspects of previously billed
shipments.
|
|
(2)
|
Uncollectible
accounts written off, net of
recoveries.
|
|
(3)
|
Adjustments
to billed accounts receivable.
|
|
No.
|
Exhibit
|
|
|
3.1
|
Restated
Charter of the registrant (incorporated herein by reference to Exhibit
3
to the registrant’s Current Report on Form 8-K filed with the Securities
and Exchange Commission on May 28, 1999 (File No.
0-22490))
|
|
|
3.2
|
Amended
and Restated Bylaws of the registrant (incorporated herein by reference
to
Exhibit 3.2 to the registrant’s Quarterly Report on Form 10-Q for the
quarterly period ended September 30, 2004 filed with the Securities
and
Exchange Commission on November 2, 2004 (File No.
0-22490))
|
|
|
4.1
|
Form
of Landair Services, Inc. Common Stock Certificate (incorporated
herein by
reference to Exhibit 4.1 to the registrant’s Registration Statement on
Form S-1 filed with the Securities and Exchange Commission on September
27, 1993 (File No. 0-22490))
|
|
|
4.2
|
Form
of Forward Air Corporation Common Stock Certificate (incorporated
herein
by reference to Exhibit 4.1 to the registrant’s Quarterly Report on Form
10-Q for the quarterly period ended September 30, 1998 filed with
the
Securities and Exchange Commission on November 16, 1998 (File No.
0-22490))
|
|
|
4.3
|
Rights
Agreement, dated May 18, 1999, between the registrant and SunTrust
Bank,
Atlanta, N.A., including the Form of Rights Certificate (Exhibit
A) and
the Form of Summary of Rights (Exhibit B) (incorporated herein by
reference to Exhibit 4 to the registrant’s Current Report on Form 8-K
filed with the Securities and Exchange Commission on May 28, 1999
(File
No. 0-22490))
|
|
|
10.1*
|
Forward
Air Corporation 2005 Employee Stock Purchase Plan (incorporated herein
by
reference to the registrant’s Proxy Statement filed with the Securities
and Exchange Commission on April 20, 2005 (File No.
0-22490))
|
|
|
10.2*
|
Amended
and Restated Stock Option and Incentive Plan (incorporated herein
by
reference to Exhibit 10.1 to the registrant’s Quarterly Report on Form
10-Q for the period ended June 30, 1995 filed with the Securities
and
Exchange Commission on August 14, 1995 (File No.
0-22490))
|
|
|
10.4
|
Air
Carrier Certificate, effective August 28, 2003 (incorporated herein
by
reference to Exhibit 10.5 to the registrant’s Annual Report on Form 10-K
for the fiscal year ended December 31, 2003 filed with the Securities
and
Exchange Commission on March 11, 2004 (File No.
0-22490))
|
|
|
10.5*
|
Non-Employee
Director Stock Option Plan (incorporated herein by reference to Exhibit
10.2 to the registrant’s Quarterly Report on Form 10-Q for the period
ended June 30, 1995 filed with the Securities and Exchange Commission
on
August 14, 1995 (File No. 0-22490))
|
|
|
10.6*
|
Amendment
to the Non-Employee Director Stock Option Plan (incorporated herein
by
reference to Exhibit 10.7 to the registrant’s Annual Report on Form 10-K
for the fiscal year ended December 31, 2003 filed with the Securities
and
Exchange Commission on March 11, 2004 (File No.
0-22490))
|
|
|
10.7
|
Amended
and Restated Loan and Security Agreement, dated as of September 10,
1998,
between First Tennessee Bank National Association and the registrant
(incorporated herein by reference to Exhibit 10.5 to the registrant’s
Quarterly Report on Form 10-Q for the period ended September 30,
1998
filed with the Securities and Exchange Commission on November 16,
1998
(File No. 0-22490))
|
|
|
10.8
|
Modification
Agreement (to Amended and Restated Loan and Security Agreement),
dated as
of June 18, 2002, among the registrant, First Tennessee Bank National
Association, FAF, Inc., Forward Air, Inc. and Transportation Properties,
Inc. (incorporated herein by reference to Exhibit 10.1 to the registrant’s
Quarterly Report on Form 10-Q for the period ended June 30, 2002
filed
with the Securities and Exchange Commission on August 14, 2002 (File
No.
0-22490))
|
|
10.9
|
Letter
Agreement, dated May 17, 2005, between the registrant and First Tennessee
Bank National Association extending the maturity date of the registrant’s
$20.0 million Master Secured Promissory Note under the Amended and
Restated Loan and Security Agreement, dated as of September 10, 1998,
as
modified by Modification Agreement, dated as of June 18, 2002
(incorporated herein by reference to Exhibit 10.1 to the registrant’s
Quarterly Report on Form 10-Q for the period ended June 30, 2005
filed
with the Securities and Exchange Commission on August 9, 2005 (File
No.
0-22490))
|
|
|
10.10
|
Letter
Agreement, dated as of May 25, 2006, between the registrant and First
Tennessee Bank National Association extending the maturity date of
the
registrant’s $20.0 million Master Secured Promissory Note under the
Amended and Restated Loan and Security Agreement, dated as of September
10, 1998, as modified by Modification Agreement, dated as of June
18, 2002
and by Letter Agreement, dated May 17, 2005 (incorporated herein
by
reference to Exhibit 10.1 to the registrant’s Quarterly Report on Form
10-Q for the period ended June 30, 2006 filed with the Securities
and
Exchange Commission on August 4, 2006 (File No.
0-22490))
|
|
|
10.11*
|
Employment
Agreement dated January 24, 2006, between Forward Air Corporation
and
Bruce A. Campbell, including Exhibit A, Restrictive Covenants Agreement
entered into contemporaneously with and as part of the Employment
Agreement (incorporated herein by reference to Exhibit 99.1 to the
registrant’s Current Report on Form 8-K filed with the Securities and
Exchange Commission on January 26, 2006 (File No.
0-22490))
|
|
|
10.12*
|
Form
of Incentive Stock Option Agreement under the registrant’s Amended and
Restated Stock Option and Incentive Plan, as amended, and 1999 Stock
Option and Incentive Plan, as amended, for grants prior to February
12,
2006 (incorporated herein by reference to Exhibit 10.12 to the
registrant’s Annual Report on Form 10-K/A for the fiscal year ended
December 31, 2005 filed with the Securities and Exchange Commission
on
March 22, 2006 (File No. 0-22490))
|
|
|
10.13*
|
Form
of Non-Qualified Stock Option Agreement under the registrant’s
Non-Employee Director Stock Option Plan, as amended, for grants prior
to
February 12, 2006 (incorporated herein by reference to Exhibit 10.13
to
the registrant’s Annual Report on Form 10-K/A for the fiscal year ended
December 31, 2005 filed with the Securities and Exchange Commission
on
March 22, 2006 (File No. 0-22490))
|
|
|
10.14*
|
1999
Stock Option and Incentive Plan (incorporated herein by reference
to
Exhibit 10.1 to the registrant’s Quarterly Report on Form 10-Q for the
period ended March 31, 1999 filed with the Securities and Exchange
Commission on May 17, 1999 (File No. 0-22490))
|
|
|
10.15*
|
Amendment
to the 1999 Stock Option and Incentive Plan (incorporated herein
by
reference to Exhibit 10.14 to the registrant’s Annual Report on Form 10-K
for the fiscal year ended December 31, 2003 filed with the Securities
and
Exchange Commission on March 11, 2004 (File No.
0-22490))
|
|
|
10.16*
|
Non-Qualified
Stock Option Agreement dated August 21, 2000 between the registrant
and
Ray A. Mundy (incorporated herein by reference to Exhibit 10.1 to
the
registrant’s Quarterly Report on Form 10-Q for the period ended September
30, 2000 filed with the Securities and Exchange Commission on November
6,
2000 (File No. 0-22490))
|
|
|
10.17
|
Forward
Air Corporation Section 125 Plan (incorporated herein by reference
to
Exhibit 10.18 to the registrant’s Annual Report on Form 10-K for the
fiscal year ended December 31, 2001 filed with the Securities and
Exchange
Commission on March 15, 2002 (File No. 0-22490))
|
|
|
10.18*
|
Form
of Option Restriction Agreement between the registrant and each executive
officer regarding certain restrictions on transferability of accelerated
stock options granted under the registrant’s 1999 Stock Option and
Incentive Plan, as amended (incorporated herein by reference to Exhibit
10.18 to the registrant’s Annual Report on Form 10-K/A for the fiscal year
ended December 31, 2005 filed with the Securities and Exchange Commission
on March 22, 2006 (File No.
0-22490))
|
|
10.19*
|
Form
of Restricted Stock Agreement for an award of restricted stock under
the
registrant’s 1999 Stock Option and Incentive Plan, as amended, granted on
or after February 12, 2006 (incorporated herein by reference to Exhibit
10.19 to the registrant’s Annual Report on Form 10-K/A for the fiscal year
ended December 31, 2005 filed with the Securities and Exchange Commission
on March 22, 2006 (File No. 0-22490))
|
|
|
10.20*
|
2006
Non-Employee Director Stock Plan (incorporated by reference
to Appendix A of the registrant’s Proxy Statement filed with the
Securities and Exchange Commission on April 24, 2006 (File No.
22490))
|
|
10.21*
|
Form
of Non-Employee Director Restricted Stock Agreement for an award
of
restricted stock under the registrant's 2006 Non-Employee Director
Stock
Plan (incorporated by reference to Exhibit 99.2 to the registrant's
Registration Statement on Form S-8 filed with the Securities and
Exchange
Commission on May 19, 2006 (File No. 22490))
|
|
|
10.22*
|
Schedule
of Non-Employee Director Compensation effective May 24, 2006 (incorporated
herein by reference to Exhibit 99.1 to the registrant’s Current Report on
Form 8-K filed with the Securities and Exchange Commission on May
23, 2006
(File No. 0-22490))
|
|
|
10.23
|
Agreement
of Purchase and Sale, dated as of July 10, 2006, among AMB Property
II,
L.P., Headlands Realty Corporation and Forward Air, Inc. (incorporated
herein by reference to Exhibit 10.2 to the registrant’s Quarterly Report
on Form 10-Q for the quarterly period ended June 30, 2006 filed with
the
Securities and Exchange Commission on August 4, 2006 (File No.
0-22490))
|
|
|
10.24
|
Agreement
of Purchase and Sale, dated as of September 14, 2006, by and between
Headlands Realty Corporation and Forward Air, Inc. (incorporated
herein by
reference to Exhibit 10.2 to the registrant’s Quarterly Report on Form
10-Q for the quarterly period ended September 30, 2006 filed with the
Securities and Exchange Commission on November 3, 2006 (File No.
0-22490))
|
|
|
14.1
|
Code
of Ethics (incorporated herein by reference to Exhibit 14.1 to the
registrant’s Annual Report on Form 10-K for the fiscal year ended December
31, 2003 filed with the Securities and Exchange Commission on March
11,
2004 (File No. 0-22490))
|
|
|
21.1
|
Subsidiaries
of the registrant (incorporated herein by reference to Exhibit 21.1
to the
registrant’s Annual Report on Form 10-K for the fiscal year ended December
31, 2000 filed with the Securities and Exchange Commission on April
2,
2001 (File No. 0-22490))
|
|