Exhibit 99.8 Supplemental Information on Forward Air’s Acquisition of Omni Logistics August 13, 2023
Forward-Looking Statements This presentation includes forward-looking statements within the meaning of Section 27A of the Securities Act of 1933 and Section 21E of the Securities Exchange Act of 1934, which are made pursuant to the safe harbor provisions of the Private Securities Litigation Reform Act of 1995, as amended. These statements may reflect Forward Air Corporation’s (“Forward”) expectations, beliefs, hopes, intentions or strategies regarding, among other things, the potential transaction (the “Proposed Acquisition”) between Forward and Omni Logistics, LLC (“Omni”), the expected timetable for completing the Proposed Acquisition (including the timing for realizing any such synergies and the conversion of revenue synergies to adjusted EBITDA), the benefits and expected cost and revenue synergies of the Proposed Acquisition and future opportunities for the combined company, as well as other statements that are other than historical fact, including, without limitation, statements concerning future financial performance, future debt and financing levels (including the achievement of targeted deleveraging within the expected time frames or at all), investment objectives, implications of litigation and regulatory investigations and other management plans for future operations and performance. Words such as “anticipate(s),” “expect(s)”, “intend(s)”, “plan(s)”, “target(s)”, “project(s)”, “believe(s)”, “will”, “aim”, “would”, “seek(s)”, “estimate(s)” and similar expressions are intended to identify such forward-looking statements. Forward-looking statements are based on management’s current expectations, projections, estimates, assumptions and beliefs and are subject to a number of known and unknown risks, uncertainties and other factors that could lead to actual results materially different from those described in the forward-looking statements. Forward can give no assurance that its expectations will be attained. Forward’s actual results, liquidity and financial condition may differ from the anticipated results, liquidity and financial condition indicated in these forward- looking statements. We caution readers that any such statements are based on currently available operational, financial and competitive information, and they should not place undue reliance on these forward-looking statements, which reflect management’s opinion only as of the date on which they were made. These forward-looking statements are not a guarantee of future performance and involve risks and uncertainties, and there are certain important factors that could cause Forward’s actual results to differ, possibly materially, from expectations or estimates reflected in such forward-looking statements, including, but without limitation: • the parties’ ability to consummate the Proposed Acquisition and to meet expectations regarding the timing and completion thereof; • the satisfaction or waiver of the conditions to the completion of the Proposed Acquisition, including the receipt of all required regulatory approvals or clearances in a timely manner and on terms acceptable to Forward; • the risk that the parties may be unable to achieve the expected strategic, financial and other benefits of the Proposed Acquisition, including the realization of expected synergies and the achievement of deleveraging targets, within the expected time-frames or at all; • the risk that the committed financing necessary for the consummation of the Proposed Acquisition is unavailable at the closing, and that any replacement financing may not be available on similar terms, or at all; • the risk that the businesses will not be integrated successfully or that integration may be more difficult, time-consuming or costly than expected; • the risk that operating costs, customer loss and business disruption (including, without limitation, difficulties in maintaining relationships with employees, customers, clients or suppliers) may be greater than expected following the Proposed Acquisition; • the risk that, if Forward does not obtain the necessary shareholder approval for the conversion of the perpetual non-voting convertible preferred stock to be issued by Forward in the Proposed Acquisition, Forward will be required to pay an annual dividend on such preferred stock; 2
Forward-Looking Statements (Cont’d) • the risks associated with being a holding company with the only material assets after completion of the Proposed Acquisition being the interest in the combined business and, accordingly, dependency upon distributions from the combined business to pay taxes and other expenses; • the requirement for Forward to pay certain tax benefits that it may claim in the future, and the expected materiality of these amounts; • risks associated with organizational structure, including payment obligations under the tax receivable agreement, which may be significant, and any accelerations or significant increases thereto; • the inability to realize all or a portion of the tax benefits that are currently expected to result from the acquisition of certain corporate owners of Omni, certain pre-existing tax attributes of Omni shareholders and tax attributes that may arise on the distribution of cash to other Omni shareholders in connection with the Proposed Acquisition, as well as the future exchanges of units of Forward’s operating subsidiary and payments made under the tax receivables agreement; • increases in interest rates; • changes in Forward’s credit ratings and outlook; • risks relating to the indebtedness Forward expects to incur in connection with the Proposed Acquisition and the need to generate sufficient cash flows to service and repay such debt; • the ability to generate the significant amount of cash needed to service the indebtedness; • the limitations and restrictions in surviving agreements governing indebtedness; • risks associated with the need to obtain additional financing which may not be available or, if it is available, may result in a reduction in the ownership of current Forward shareholders; • and general economic and market conditions. These and other risks and uncertainties are more fully discussed in the risk factors identified in “Item 1A. Risk Factors” in Part I of Forward’s most recently filed Annual Report on Form 10- K, and as may be identified in Forward’s Quarterly Reports on Form 10-Q and current reports on Form 8-K. Except to the extent required by law, Forward expressly disclaims any obligation to release publicly any updates or revisions to any forward-looking statements contained herein to reflect any change in Forward’s expectations with regard thereto or change in events, conditions or circumstances on which any statement is based. Non-GAAP Measures To supplement the financial measures prepared in accordance with generally accepted accounting principles in the United States (“GAAP”), we have included Adjusted Revenue, Adjusted EBITDA, Adjusted EBITDA Margin, Adjusted EBITDA Leverage Ratio and Net Revenue, non-GAAP financial measures, in this presentation. The reconciliation of these non-GAAP measures to the most directly comparable financial measure calculated and presented in accordance with GAAP can be found in the Appendix to this presentation. Because these non-GAAP measures excludes certain items as described herein, they may not be indicative of the results that Forward expects to recognize for future periods. As a result, these non-GAAP measures should be considered in addition to, and not a substitute for, financial information prepared in accordance with GAAP. 3
Table of Contents 01. Introduction to Omni 02. Strategic Rationale Financial Benefits and Value Creation 03. Transaction Structure 04. 05. Recap and Conclusion 4 4
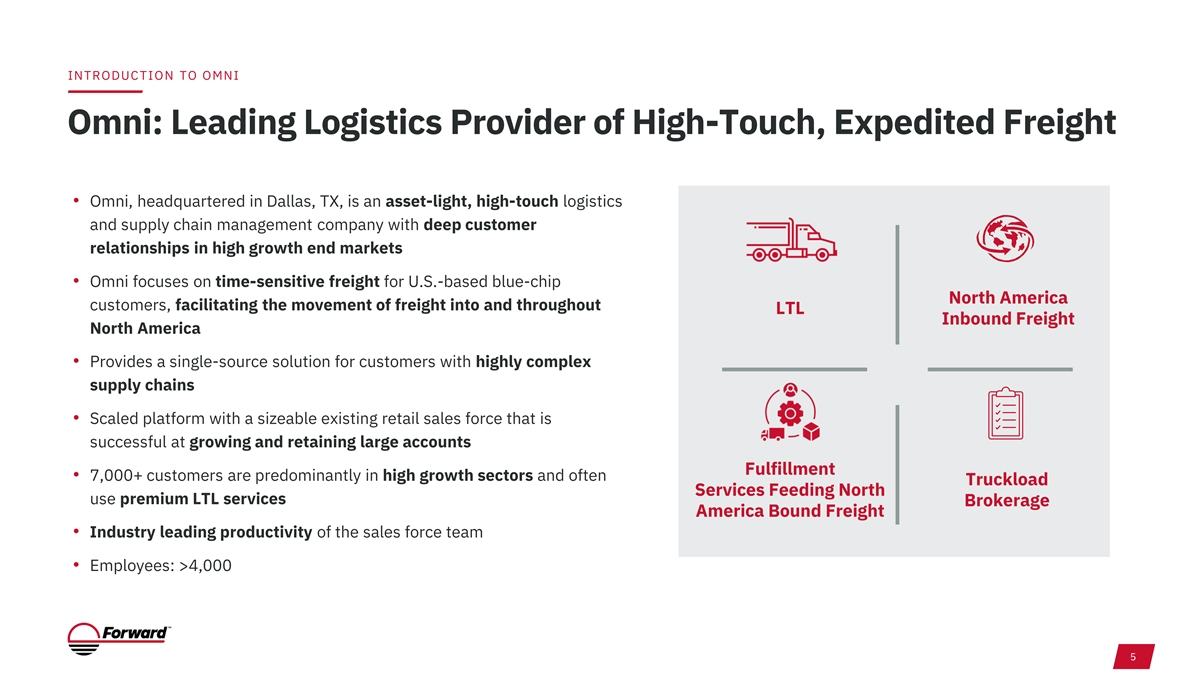
INTRODUCTION TO OMNI Omni: Leading Logistics Provider of High-Touch, Expedited Freight • Omni, headquartered in Dallas, TX, is an asset-light, high-touch logistics and supply chain management company with deep customer relationships in high growth end markets • Omni focuses on time-sensitive freight for U.S.-based blue-chip North America customers, facilitating the movement of freight into and throughout LTL Inbound Freight North America • Provides a single-source solution for customers with highly complex supply chains • Scaled platform with a sizeable existing retail sales force that is successful at growing and retaining large accounts Fulfillment • 7,000+ customers are predominantly in high growth sectors and often Truckload Services Feeding North use premium LTL services Brokerage America Bound Freight • Industry leading productivity of the sales force team • Employees: >4,000 5
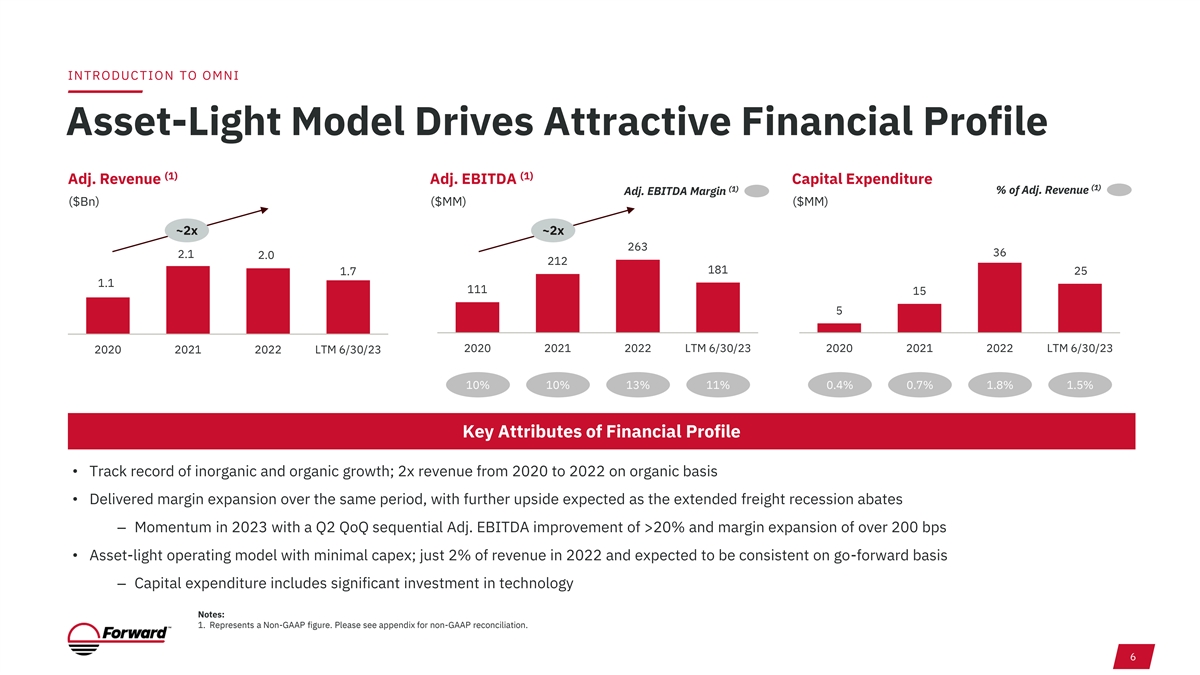
INTRODUCTION TO OMNI Asset-Light Model Drives Attractive Financial Profile (1) (1) Adj. Revenue Adj. EBITDA Capital Expenditure (1) (1) % of Adj. Revenue Adj. EBITDA Margin ($Bn) ($MM) ($MM) ~2x ~2x 263 36 2.1 2.0 212 181 1.7 25 1.1 111 15 5 2020 2021 2022 LTM 6/30/23 2020 2021 2022 LTM 6/30/23 2020 2021 2022 LTM 6/30/23 10% 10% 13% 11% 0.4% 0.7% 1.8% 1.5% Key Attributes of Financial Profile • Track record of inorganic and organic growth; 2x revenue from 2020 to 2022 on organic basis • Delivered margin expansion over the same period, with further upside expected as the extended freight recession abates – Momentum in 2023 with a Q2 QoQ sequential Adj. EBITDA improvement of >20% and margin expansion of over 200 bps • Asset-light operating model with minimal capex; just 2% of revenue in 2022 and expected to be consistent on go-forward basis ‒ Capital expenditure includes significant investment in technology Notes: 1. Represents a Non-GAAP figure. Please see appendix for non-GAAP reconciliation. 6
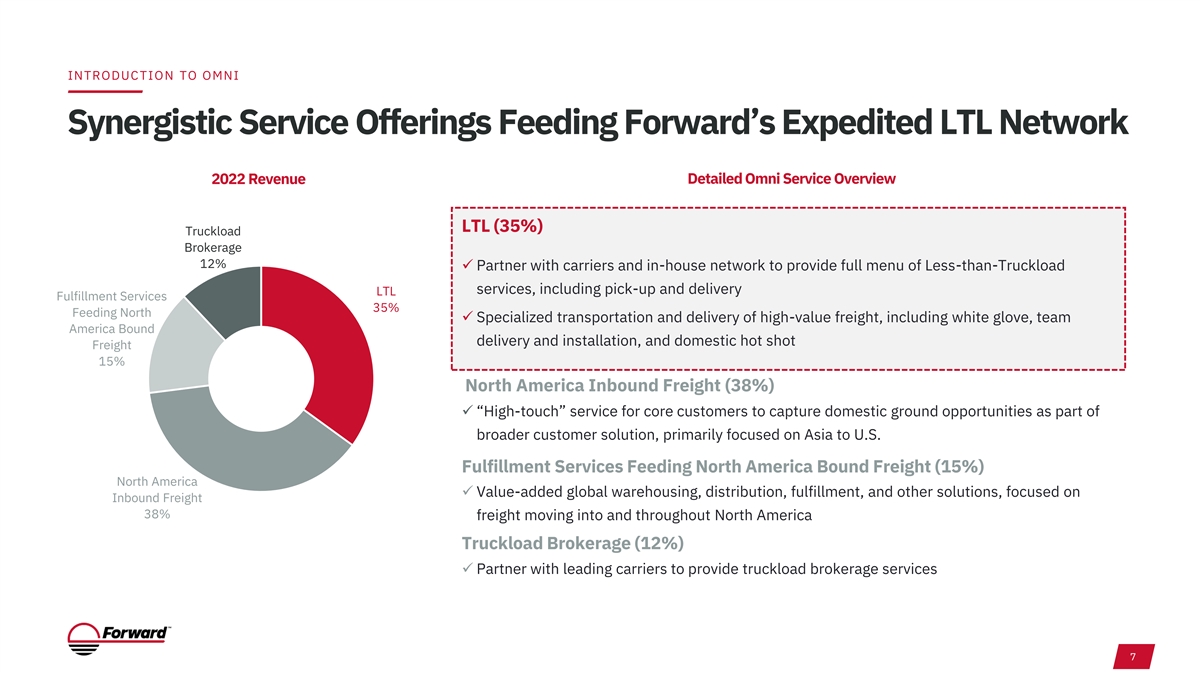
INTRODUCTION TO OMNI Synergistic Service Offerings Feeding Forward’s Expedited LTL Network 2022 Revenue Detailed Omni Service Overview LTL (35%) Truckload Brokerage 12% ✓ Partner with carriers and in-house network to provide full menu of Less-than-Truckload services, including pick-up and delivery LTL Fulfillment Services 35% Feeding North ✓ Specialized transportation and delivery of high-value freight, including white glove, team America Bound delivery and installation, and domestic hot shot Freight 15% North America Inbound Freight (38%) ✓ “High-touch” service for core customers to capture domestic ground opportunities as part of broader customer solution, primarily focused on Asia to U.S. Fulfillment Services Feeding North America Bound Freight (15%) North America ✓ Value-added global warehousing, distribution, fulfillment, and other solutions, focused on Inbound Freight 38% freight moving into and throughout North America Truckload Brokerage (12%) ✓ Partner with leading carriers to provide truckload brokerage services 7
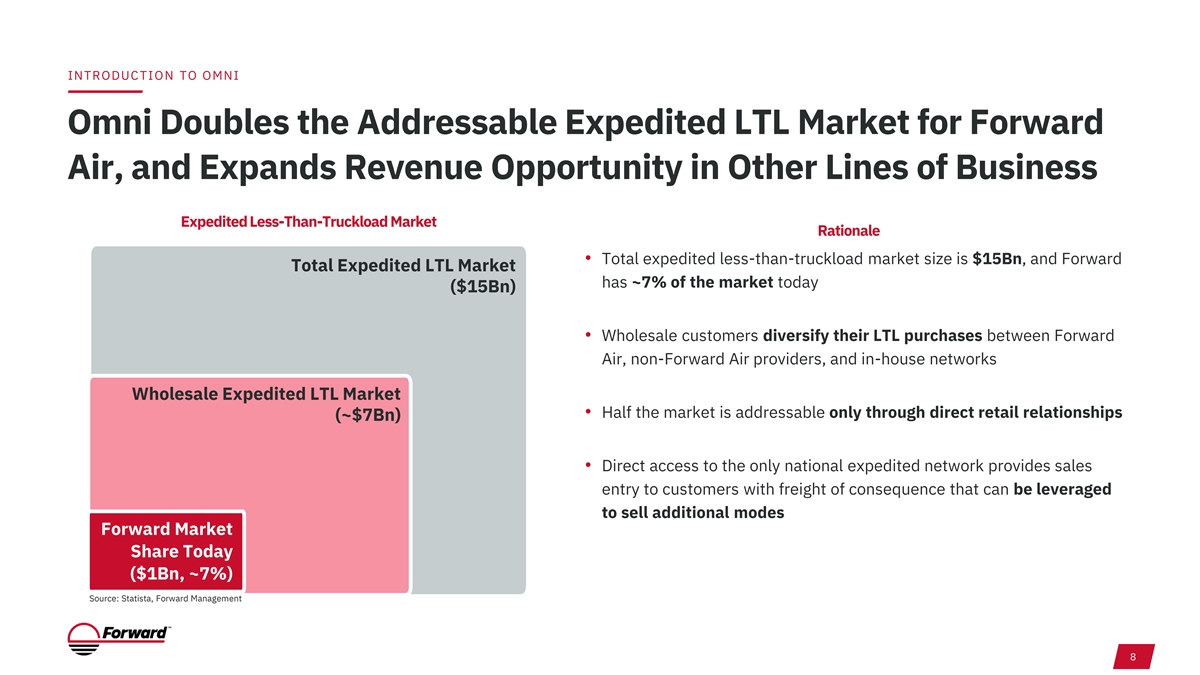
INTRODUCTION TO OMNI Omni Doubles the Addressable Expedited LTL Market for Forward Air, and Expands Revenue Opportunity in Other Lines of Business Expedited Less-Than-Truckload Market Rationale • Total expedited less-than-truckload market size is $15Bn, and Forward Total Expedited LTL Market has ~7% of the market today ($15Bn) • Wholesale customers diversify their LTL purchases between Forward Air, non-Forward Air providers, and in-house networks Wholesale Expedited LTL Market • Half the market is addressable only through direct retail relationships (~$7Bn) • Direct access to the only national expedited network provides sales entry to customers with freight of consequence that can be leveraged to sell additional modes Forward Market Share Today ($1Bn, ~7%) Source: Statista, Forward Management 8

INTRODUCTION TO OMNI Blue Chip Customers with Significant Expedited LTL Spend Representative Blue-Chip Customer Base Omni services the global supply chains of largely North America-based customers Over 75% of Omni’s net revenue is from time critical end markets that often use premium LTL End Market Overview (1) 2022 Net Revenue Electronics Medical Devices Other Healthcare/Life 10% Sciences 6% High-End Consumer Goods 35% Media 6% Logistics Technology Automotive Transportation 13% Technology Omni consistently onboards new customers who require 30% time-sensitive freight services Notes: 1. Net revenue represents non-GAAP figure. Net revenue represents revenue less cost of sales. 9

STRATEGIC RATIONALE Omni Will Drive Volumes and Margin to Forward’s Expedited LTL Network • Expands Expedited Fright Customer Base − Forward and Omni complement each other and will be able to provide customers cost savings on moving high quality, time sensitive freight − ~35% of Omni’s business is LTL, remainder is focused on bringing high-value goods into and throughout the U.S. • Enhances Platform Scale and Margin (1) − Forward current scale to double, with Adj. Revenues of ~$3.7B for twelve months ended June 30, 2023 − Combination removes an organization’s gross margin between shipper and destination − Omni originated LTL moved by Forward will be margin enhancing for Forward, allowing Forward to capture both wholesale and retail margin on the same revenue. EBITDA margin on such moves is expected to be greater than 20% • Broader Service Offering Will Drive Incremental Business into the Forward LTL Network − Complementary services support the long-term growth of Forward’s Expedited LTL business − Omni’s domestic business generates significant LTL freight volumes which can be moved onto Forward network − Omni’s international freight transportation services move high value freight to North America that will feed the Forward network • Combines Industry – Leading Teams − Acquisition allows Forward to go directly to shippers while maintaining and growing with our historic wholesale customers − Positions Forward for long term growth of the business model by expanding the customer base to include shippers, 3PL, forwarders and airlines − Omni’s retail salesforce sells significant amount of high value LTL freight (which is often fulfilled by Forward) and as such already has a strong understanding of the combined footprint and service capabilities to market the combined offering − Strong commercial engine enables pro-active cross sell revenue synergies in LTL along with complementary Omni services − Adds deep retail sales expertise to an already strong wholesale sales and account management team − To drive growth in both the wholesale and retail markets, Forward will go to market with two sales organizations with channel expertise • Expands Geographic Footprint and Capacity − Combined company will have 300+ locations, creating a network flywheel for customers through the addition of Omni’s 40+ strategically located terminals across the United States − Addition of Omni’s presence in Europe, Asia, and South America is expected to expand Forward’s international capabilities and allow Forward to provide extended logistics services support for global customers Notes: 1. Represents a non-GAAP figure. Please see appendix for a non-GAAP reconciliation. Assumes full realization of expected synergy opportunities, based on management estimates. Synergy opportunities are exclusive of one- time costs necessary to achieve such synergies, estimated to be approximately $36MM. Estimated revenue-based EBITDA synergy opportunities have been converted into EBITDA estimates assuming the full realization of 10 the revenue synergy opportunities, based on an assumed margin percentage of 21%. This assumed margin percentage is based on management’s estimates and an analysis of incremental margin by revenue segment.
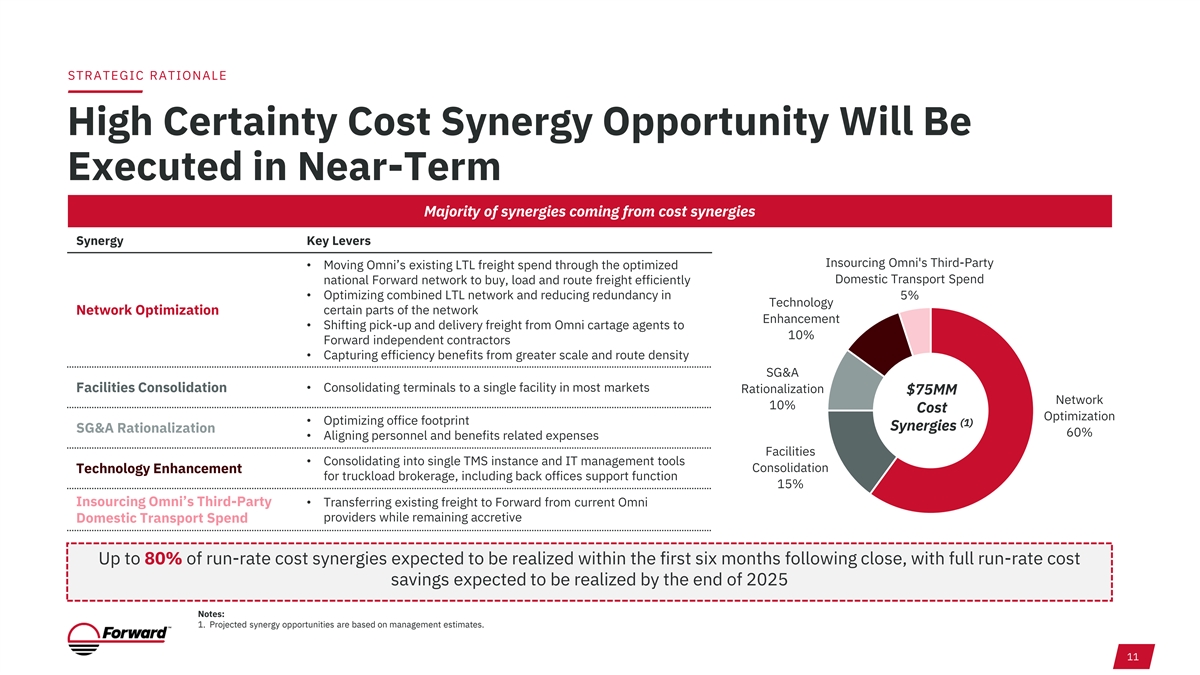
STRATEGIC RATIONALE High Certainty Cost Synergy Opportunity Will Be Executed in Near-Term Majority of synergies coming from cost synergies Synergy Key Levers Insourcing Omni's Third-Party • Moving Omni’s existing LTL freight spend through the optimized Domestic Transport Spend national Forward network to buy, load and route freight efficiently • Optimizing combined LTL network and reducing redundancy in 5% Technology Network Optimization certain parts of the network Enhancement • Shifting pick-up and delivery freight from Omni cartage agents to 10% Forward independent contractors • Capturing efficiency benefits from greater scale and route density SG&A Facilities Consolidation • Consolidating terminals to a single facility in most markets Rationalization $75MM Network 10% Cost Optimization • Optimizing office footprint (1) Synergies SG&A Rationalization 60% • Aligning personnel and benefits related expenses Facilities • Consolidating into single TMS instance and IT management tools Consolidation Technology Enhancement for truckload brokerage, including back offices support function 15% Insourcing Omni’s Third-Party • Transferring existing freight to Forward from current Omni providers while remaining accretive Domestic Transport Spend Up to 80% of run-rate cost synergies expected to be realized within the first six months following close, with full run-rate cost savings expected to be realized by the end of 2025 Notes: 1. Projected synergy opportunities are based on management estimates. 11
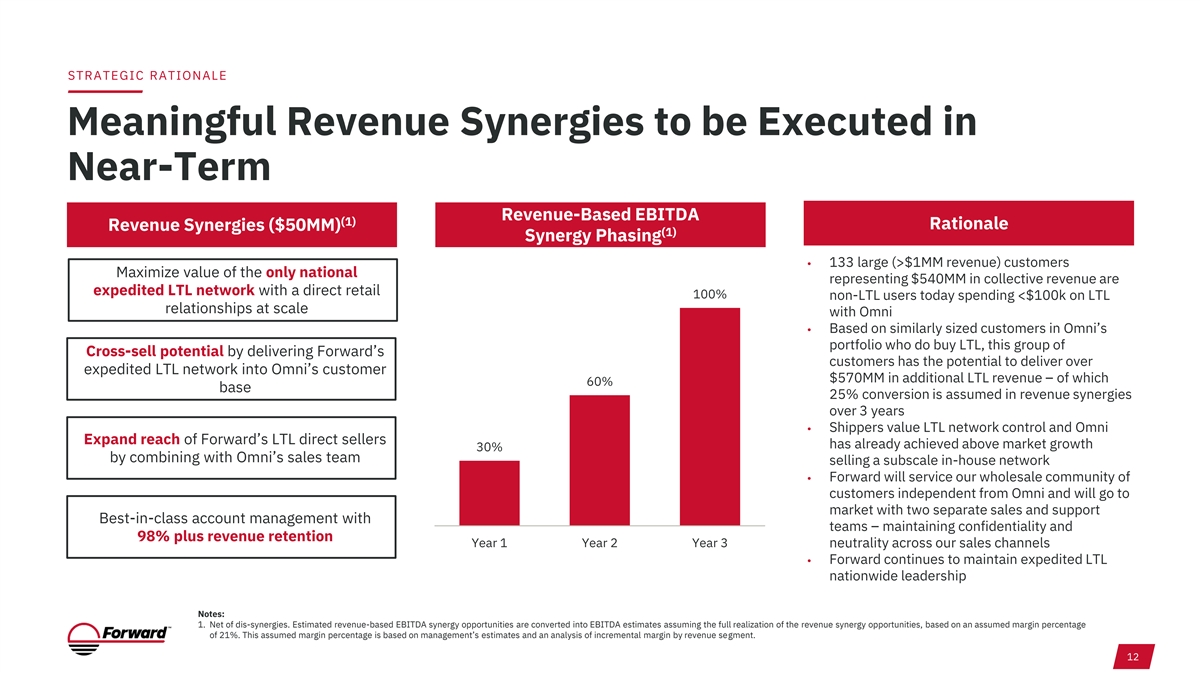
STRATEGIC RATIONALE Meaningful Revenue Synergies to be Executed in Near-Term Revenue-Based EBITDA (1) Rationale Revenue Synergies ($50MM) (1) Synergy Phasing • 133 large (>$1MM revenue) customers Maximize value of the only national representing $540MM in collective revenue are expedited LTL network with a direct retail 100% non-LTL users today spending <$100k on LTL relationships at scale with Omni • Based on similarly sized customers in Omni’s portfolio who do buy LTL, this group of Cross-sell potential by delivering Forward’s customers has the potential to deliver over expedited LTL network into Omni’s customer $570MM in additional LTL revenue – of which 60% base 25% conversion is assumed in revenue synergies over 3 years • Shippers value LTL network control and Omni Expand reach of Forward’s LTL direct sellers has already achieved above market growth 30% by combining with Omni’s sales team selling a subscale in-house network • Forward will service our wholesale community of customers independent from Omni and will go to market with two separate sales and support Best-in-class account management with teams – maintaining confidentiality and 98% plus revenue retention Year 1 Year 2 Year 3 neutrality across our sales channels • Forward continues to maintain expedited LTL nationwide leadership Notes: 1. Net of dis-synergies. Estimated revenue-based EBITDA synergy opportunities are converted into EBITDA estimates assuming the full realization of the revenue synergy opportunities, based on an assumed margin percentage of 21%. This assumed margin percentage is based on management’s estimates and an analysis of incremental margin by revenue segment. 12
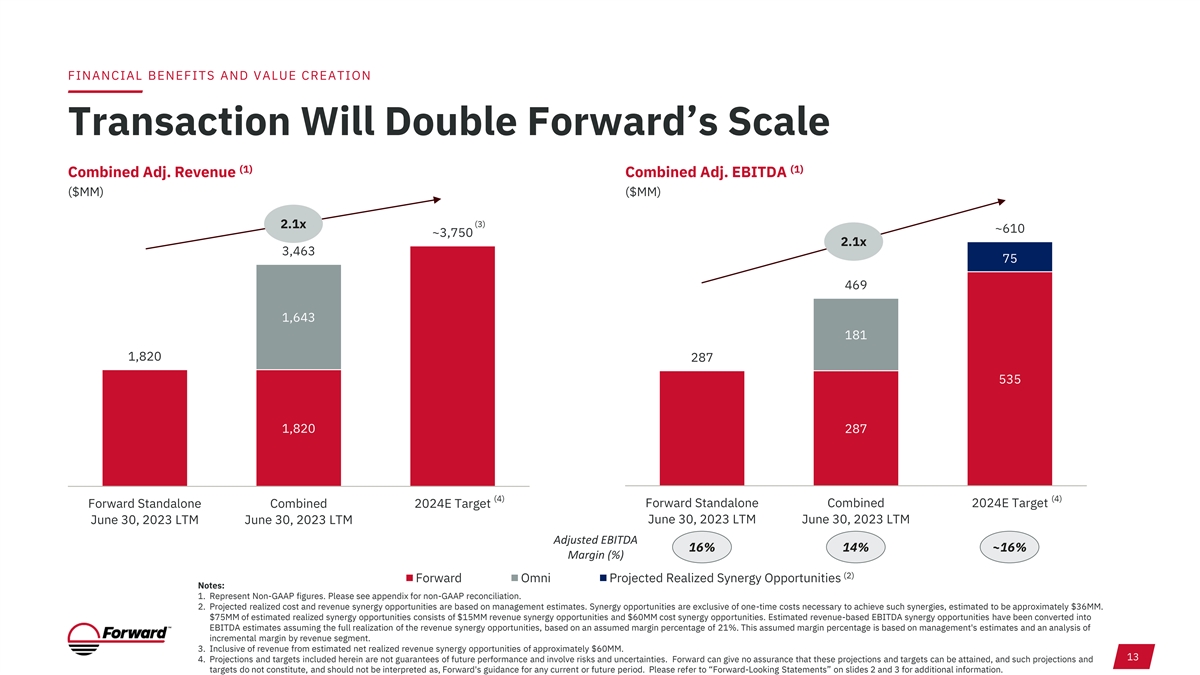
FINANCIAL BENEFITS AND VALUE CREATION Transaction Will Double Forward’s Scale (1) (1) Combined Adj. Revenue Combined Adj. EBITDA ($MM) ($MM) (3) 2.1x ~610 ~3,750 2.1x 3,463 75 469 1,643 181 1,820 287 535 1,820 287 (4) (4) Forward Standalone Combined 2024E Target Forward Standalone Combined 2024E Target June 30, 2023 LTM June 30, 2023 LTM June 30, 2023 LTM June 30, 2023 LTM Adjusted EBITDA 16% 14% ~16% Margin (%) (2) Forward Omni Projected Realized Synergy Opportunities Notes: 1. Represent Non-GAAP figures. Please see appendix for non-GAAP reconciliation. 2. Projected realized cost and revenue synergy opportunities are based on management estimates. Synergy opportunities are exclusive of one-time costs necessary to achieve such synergies, estimated to be approximately $36MM. $75MM of estimated realized synergy opportunities consists of $15MM revenue synergy opportunities and $60MM cost synergy opportunities. Estimated revenue-based EBITDA synergy opportunities have been converted into EBITDA estimates assuming the full realization of the revenue synergy opportunities, based on an assumed margin percentage of 21%. This assumed margin percentage is based on management's estimates and an analysis of incremental margin by revenue segment. 3. Inclusive of revenue from estimated net realized revenue synergy opportunities of approximately $60MM. 13 4. Projections and targets included herein are not guarantees of future performance and involve risks and uncertainties. Forward can give no assurance that these projections and targets can be attained, and such projections and targets do not constitute, and should not be interpreted as, Forward's guidance for any current or future period. Please refer to “Forward-Looking Statements” on slides 2 and 3 for additional information.
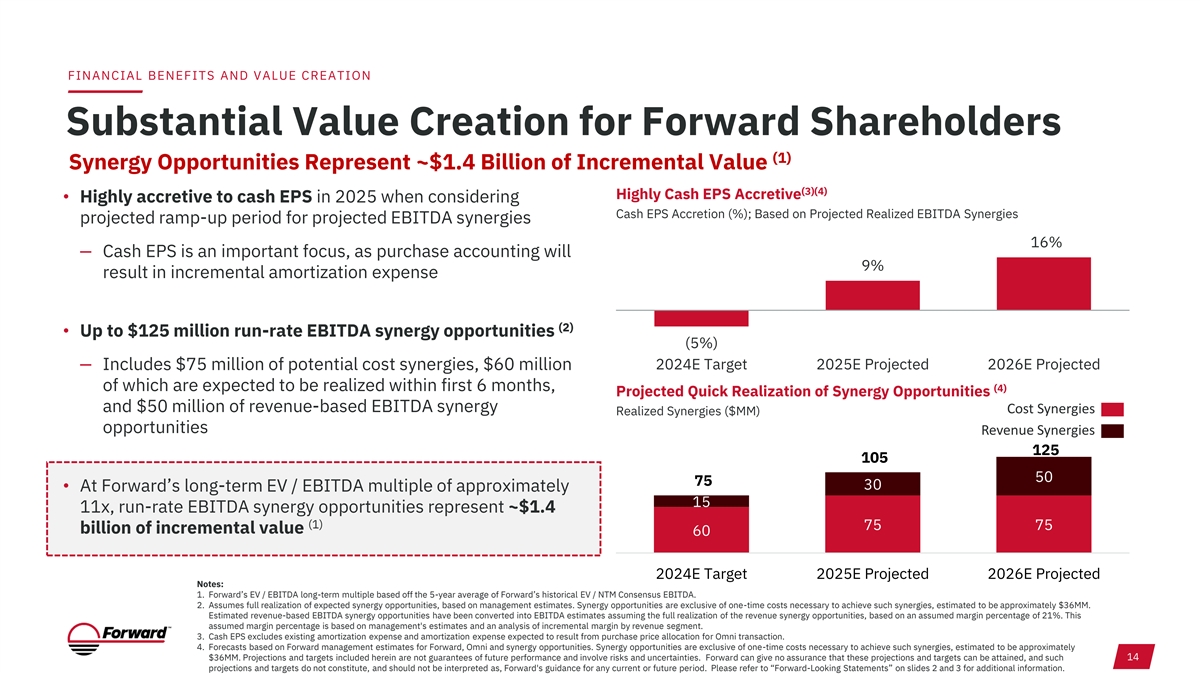
FINANCIAL BENEFITS AND VALUE CREATION Substantial Value Creation for Forward Shareholders (1) Synergy Opportunities Represent ~$1.4 Billion of Incremental Value (3)(4) Highly Cash EPS Accretive • Highly accretive to cash EPS in 2025 when considering Cash EPS Accretion (%); Based on Projected Realized EBITDA Synergies projected ramp-up period for projected EBITDA synergies 16% ‒ Cash EPS is an important focus, as purchase accounting will 9% result in incremental amortization expense (2) • Up to $125 million run-rate EBITDA synergy opportunities (5%) ‒ Includes $75 million of potential cost synergies, $60 million 2024E Target 2025E Projected 2026E Projected of which are expected to be realized within first 6 months, (4) Projected Quick Realization of Synergy Opportunities and $50 million of revenue-based EBITDA synergy Cost Synergies Realized Synergies ($MM) opportunities Revenue Synergies 125 105 50 75 30 • At Forward’s long-term EV / EBITDA multiple of approximately 15 11x, run-rate EBITDA synergy opportunities represent ~$1.4 (1) 75 75 billion of incremental value 60 2024E Target 2025E Projected 2026E Projected Notes: 1. Forward’s EV / EBITDA long-term multiple based off the 5-year average of Forward’s historical EV / NTM Consensus EBITDA. 2. Assumes full realization of expected synergy opportunities, based on management estimates. Synergy opportunities are exclusive of one-time costs necessary to achieve such synergies, estimated to be approximately $36MM. Estimated revenue-based EBITDA synergy opportunities have been converted into EBITDA estimates assuming the full realization of the revenue synergy opportunities, based on an assumed margin percentage of 21%. This assumed margin percentage is based on management's estimates and an analysis of incremental margin by revenue segment. 3. Cash EPS excludes existing amortization expense and amortization expense expected to result from purchase price allocation for Omni transaction. 4. Forecasts based on Forward management estimates for Forward, Omni and synergy opportunities. Synergy opportunities are exclusive of one-time costs necessary to achieve such synergies, estimated to be approximately 14 $36MM. Projections and targets included herein are not guarantees of future performance and involve risks and uncertainties. Forward can give no assurance that these projections and targets can be attained, and such projections and targets do not constitute, and should not be interpreted as, Forward's guidance for any current or future period. Please refer to “Forward-Looking Statements” on slides 2 and 3 for additional information.
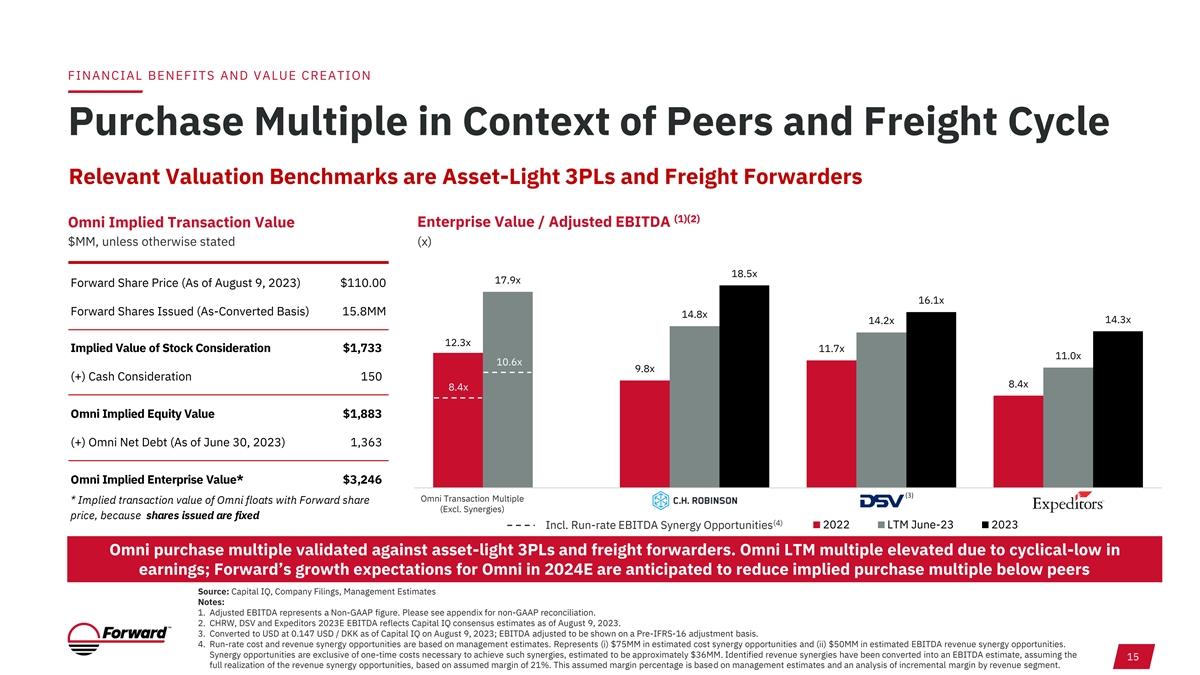
FINANCIAL BENEFITS AND VALUE CREATION Purchase Multiple in Context of Peers and Freight Cycle Relevant Valuation Benchmarks are Asset-Light 3PLs and Freight Forwarders (1)(2) Omni Implied Transaction Value Enterprise Value / Adjusted EBITDA $MM, unless otherwise stated (x) 18.5x 17.9x Forward Share Price (As of August 9, 2023) $110.00 16.1x Forward Shares Issued (As-Converted Basis) 15.8MM 14.8x 14.2x 14.3x 12.3x Implied Value of Stock Consideration $1,733 11.7x 11.0x 10.6x 9.8x (+) Cash Consideration 150 8.4x 8.4x Omni Implied Equity Value $1,883 (+) Omni Net Debt (As of June 30, 2023) 1,363 Omni Implied Enterprise Value* $3,246 (3) Omni Transaction Multiple * Implied transaction value of Omni floats with Forward share (Excl. Synergies) price, because shares issued are fixed (4) Incl. Run-rate EBITDA Synergy Opportunities 2022 LTM June-23 2023 Omni purchase multiple validated against asset-light 3PLs and freight forwarders. Omni LTM multiple elevated due to cyclical-low in earnings; Forward’s growth expectations for Omni in 2024E are anticipated to reduce implied purchase multiple below peers Source: Capital IQ, Company Filings, Management Estimates Notes: 1. Adjusted EBITDA represents a Non-GAAP figure. Please see appendix for non-GAAP reconciliation. 2. CHRW, DSV and Expeditors 2023E EBITDA reflects Capital IQ consensus estimates as of August 9, 2023. 3. Converted to USD at 0.147 USD / DKK as of Capital IQ on August 9, 2023; EBITDA adjusted to be shown on a Pre-IFRS-16 adjustment basis. 4. Run-rate cost and revenue synergy opportunities are based on management estimates. Represents (i) $75MM in estimated cost synergy opportunities and (ii) $50MM in estimated EBITDA revenue synergy opportunities. Synergy opportunities are exclusive of one-time costs necessary to achieve such synergies, estimated to be approximately $36MM. Identified revenue synergies have been converted into an EBITDA estimate, assuming the 15 full realization of the revenue synergy opportunities, based on assumed margin of 21%. This assumed margin percentage is based on management estimates and an analysis of incremental margin by revenue segment.
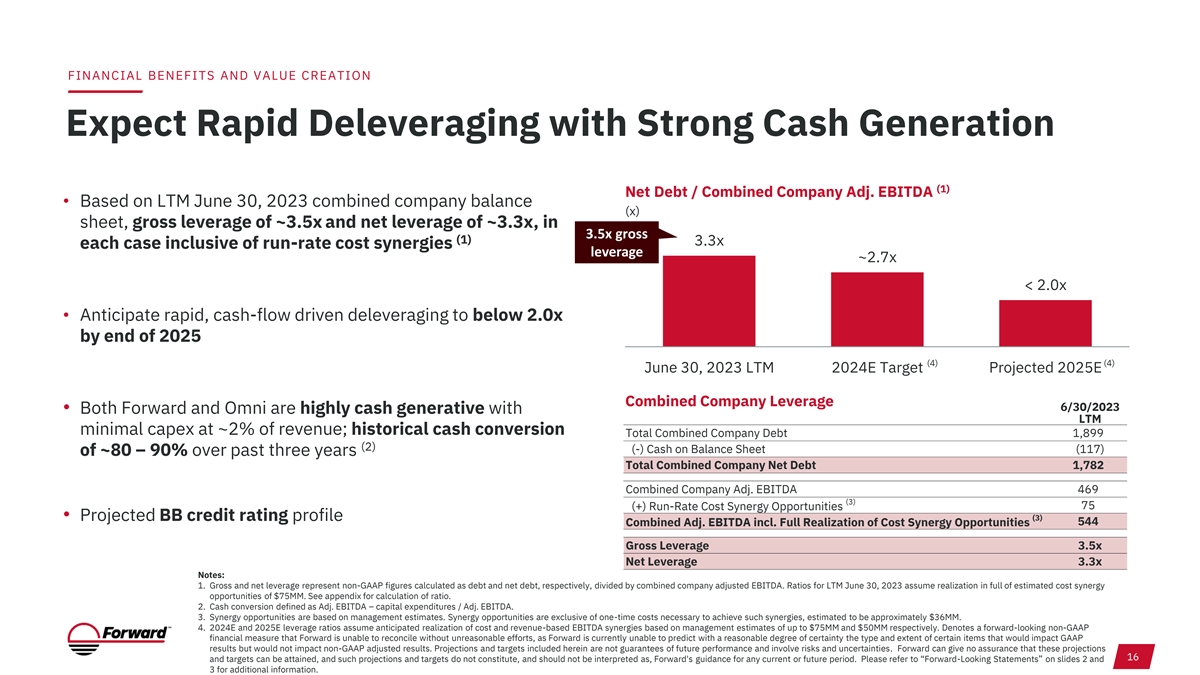
FINANCIAL BENEFITS AND VALUE CREATION Expect Rapid Deleveraging with Strong Cash Generation (1) Net Debt / Combined Company Adj. EBITDA • Based on LTM June 30, 2023 combined company balance (x) sheet, gross leverage of ~3.5x and net leverage of ~3.3x, in 3.5x gross (1) 3.3x each case inclusive of run-rate cost synergies leverage ~2.7x < 2.0x • Anticipate rapid, cash-flow driven deleveraging to below 2.0x by end of 2025 (4) (4) June 30, 2023 LTM 2024E Target Projected 2025E Combined Company Leverage 6/30/2023 • Both Forward and Omni are highly cash generative with LTM minimal capex at ~2% of revenue; historical cash conversion Total Combined Company Debt 1,899 (2) (-) Cash on Balance Sheet (117) of ~80 – 90% over past three years Total Combined Company Net Debt 1,782 Combined Company Adj. EBITDA 469 (3) (+) Run-Rate Cost Synergy Opportunities 75 • Projected BB credit rating profile (3) Combined Adj. EBITDA incl. Full Realization of Cost Synergy Opportunities 544 Gross Leverage 3.5x Net Leverage 3.3x Notes: 1. Gross and net leverage represent non-GAAP figures calculated as debt and net debt, respectively, divided by combined company adjusted EBITDA. Ratios for LTM June 30, 2023 assume realization in full of estimated cost synergy opportunities of $75MM. See appendix for calculation of ratio. 2. Cash conversion defined as Adj. EBITDA – capital expenditures / Adj. EBITDA. 3. Synergy opportunities are based on management estimates. Synergy opportunities are exclusive of one-time costs necessary to achieve such synergies, estimated to be approximately $36MM. 4. 2024E and 2025E leverage ratios assume anticipated realization of cost and revenue-based EBITDA synergies based on management estimates of up to $75MM and $50MM respectively. Denotes a forward-looking non-GAAP financial measure that Forward is unable to reconcile without unreasonable efforts, as Forward is currently unable to predict with a reasonable degree of certainty the type and extent of certain items that would impact GAAP results but would not impact non-GAAP adjusted results. Projections and targets included herein are not guarantees of future performance and involve risks and uncertainties. Forward can give no assurance that these projections 16 and targets can be attained, and such projections and targets do not constitute, and should not be interpreted as, Forward's guidance for any current or future period. Please refer to “Forward-Looking Statements” on slides 2 and 3 for additional information.
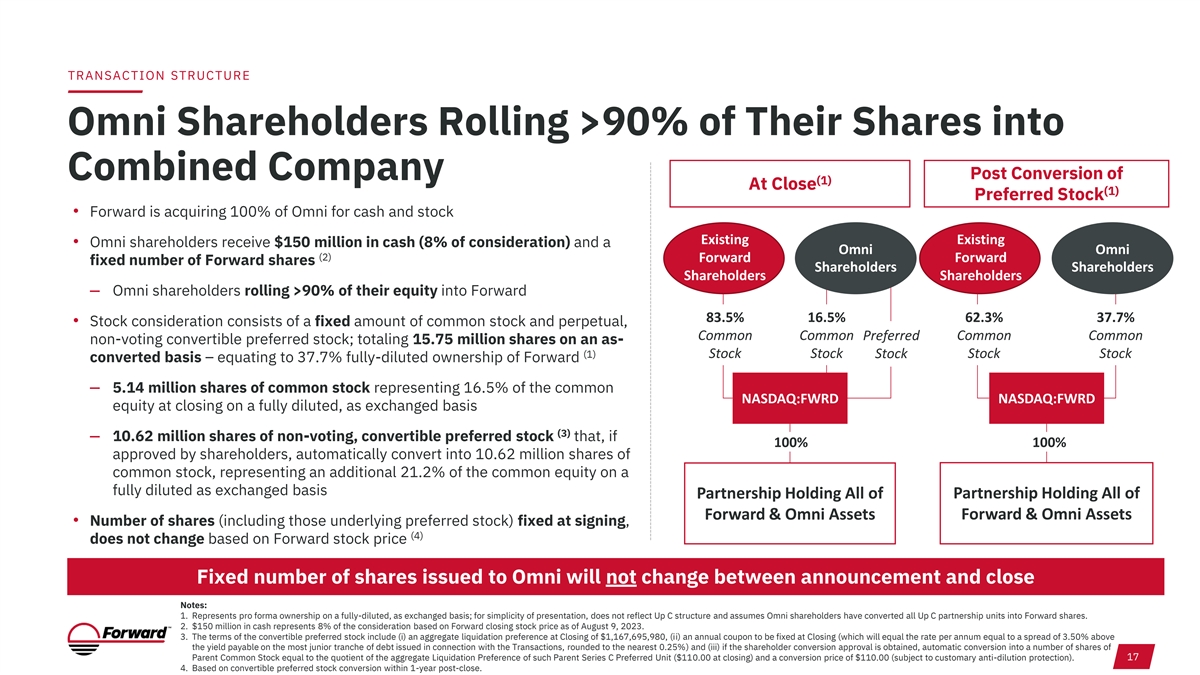
TRANSACTION STRUCTURE Omni Shareholders Rolling >90% of Their Shares into Combined Company Post Conversion of (1) At Close (1) Preferred Stock • Forward is acquiring 100% of Omni for cash and stock Existing Existing • Omni shareholders receive $150 million in cash (8% of consideration) and a Omni Omni (2) Forward Forward fixed number of Forward shares Shareholders Shareholders Shareholders Shareholders ‒ Omni shareholders rolling >90% of their equity into Forward 83.5% 16.5% 62.3% 37.7% • Stock consideration consists of a fixed amount of common stock and perpetual, Common Common Preferred Common Common non-voting convertible preferred stock; totaling 15.75 million shares on an as- (1) Stock Stock Stock Stock Stock converted basis – equating to 37.7% fully-diluted ownership of Forward ‒ 5.14 million shares of common stock representing 16.5% of the common NASDAQ:FWRD NASDAQ:FWRD equity at closing on a fully diluted, as exchanged basis (3) ‒ 10.62 million shares of non-voting, convertible preferred stock that, if 100% 100% approved by shareholders, automatically convert into 10.62 million shares of common stock, representing an additional 21.2% of the common equity on a fully diluted as exchanged basis Partnership Holding All of Partnership Holding All of Forward & Omni Assets Forward & Omni Assets • Number of shares (including those underlying preferred stock) fixed at signing, (4) does not change based on Forward stock price Fixed number of shares issued to Omni will not change between announcement and close Notes: 1. Represents pro forma ownership on a fully-diluted, as exchanged basis; for simplicity of presentation, does not reflect Up C structure and assumes Omni shareholders have converted all Up C partnership units into Forward shares. 2. $150 million in cash represents 8% of the consideration based on Forward closing stock price as of August 9, 2023. 3. The terms of the convertible preferred stock include (i) an aggregate liquidation preference at Closing of $1,167,695,980, (ii) an annual coupon to be fixed at Closing (which will equal the rate per annum equal to a spread of 3.50% above the yield payable on the most junior tranche of debt issued in connection with the Transactions, rounded to the nearest 0.25%) and (iii) if the shareholder conversion approval is obtained, automatic conversion into a number of shares of 17 Parent Common Stock equal to the quotient of the aggregate Liquidation Preference of such Parent Series C Preferred Unit ($110.00 at closing) and a conversion price of $110.00 (subject to customary anti-dilution protection). 4. Based on convertible preferred stock conversion within 1-year post-close.
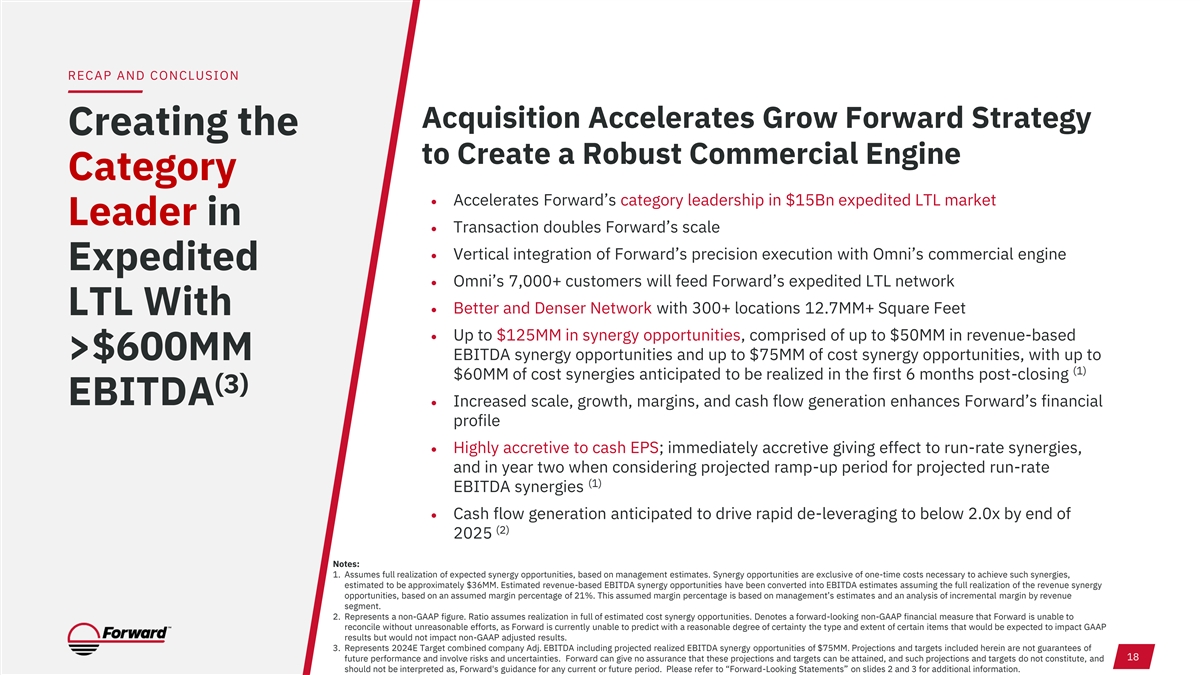
RECAP AND CONCLUSION Acquisition Accelerates Grow Forward Strategy Creating the to Create a Robust Commercial Engine Category • Accelerates Forward’s category leadership in $15Bn expedited LTL market Leader in • Transaction doubles Forward’s scale • Vertical integration of Forward’s precision execution with Omni’s commercial engine Expedited • Omni’s 7,000+ customers will feed Forward’s expedited LTL network • Better and Denser Network with 300+ locations 12.7MM+ Square Feet LTL With • Up to $125MM in synergy opportunities, comprised of up to $50MM in revenue-based >$600MM EBITDA synergy opportunities and up to $75MM of cost synergy opportunities, with up to (1) $60MM of cost synergies anticipated to be realized in the first 6 months post-closing (3) EBITDA • Increased scale, growth, margins, and cash flow generation enhances Forward’s financial profile • Highly accretive to cash EPS; immediately accretive giving effect to run-rate synergies, and in year two when considering projected ramp-up period for projected run-rate (1) EBITDA synergies • Cash flow generation anticipated to drive rapid de-leveraging to below 2.0x by end of (2) 2025 Notes: 1. Assumes full realization of expected synergy opportunities, based on management estimates. Synergy opportunities are exclusive of one-time costs necessary to achieve such synergies, estimated to be approximately $36MM. Estimated revenue-based EBITDA synergy opportunities have been converted into EBITDA estimates assuming the full realization of the revenue synergy opportunities, based on an assumed margin percentage of 21%. This assumed margin percentage is based on management’s estimates and an analysis of incremental margin by revenue segment. 2. Represents a non-GAAP figure. Ratio assumes realization in full of estimated cost synergy opportunities. Denotes a forward-looking non-GAAP financial measure that Forward is unable to reconcile without unreasonable efforts, as Forward is currently unable to predict with a reasonable degree of certainty the type and extent of certain items that would be expected to impact GAAP results but would not impact non-GAAP adjusted results. 3. Represents 2024E Target combined company Adj. EBITDA including projected realized EBITDA synergy opportunities of $75MM. Projections and targets included herein are not guarantees of 18 future performance and involve risks and uncertainties. Forward can give no assurance that these projections and targets can be attained, and such projections and targets do not constitute, and should not be interpreted as, Forward's guidance for any current or future period. Please refer to “Forward-Looking Statements” on slides 2 and 3 for additional information.

Appendix
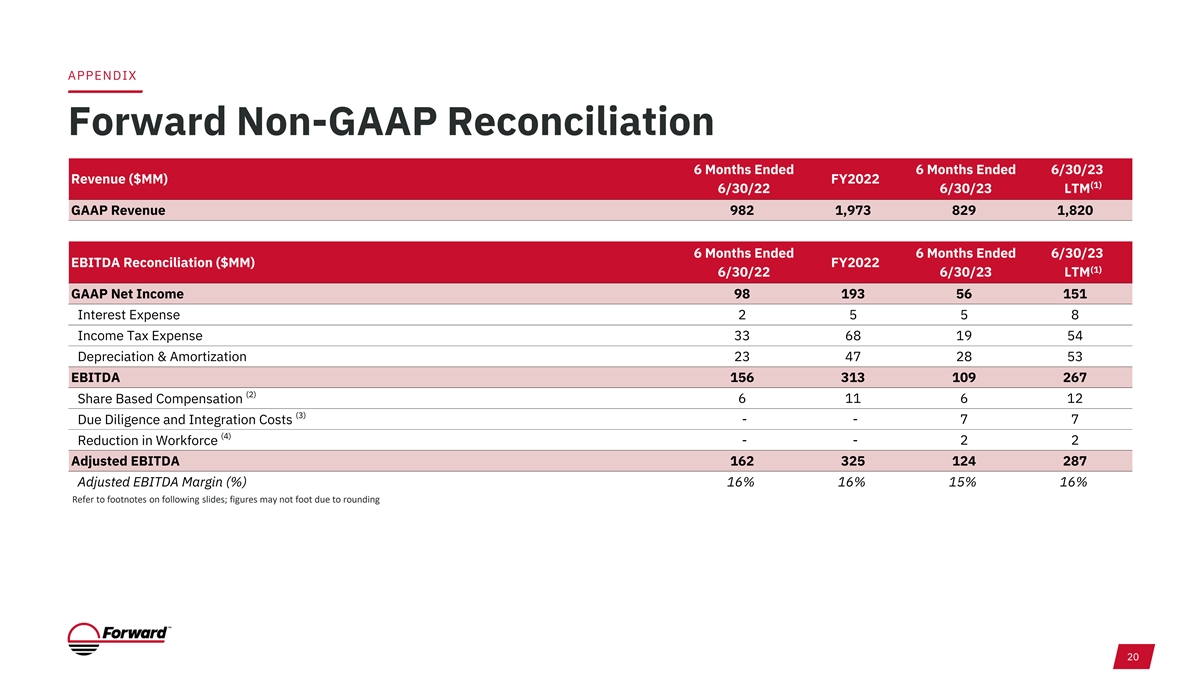
APPENDIX Forward Non-GAAP Reconciliation 6 Months Ended 6 Months Ended 6/30/23 Revenue ($MM) FY2022 (1) 6/30/22 6/30/23 LTM GAAP Revenue 982 1,973 829 1,820 6 Months Ended 6 Months Ended 6/30/23 EBITDA Reconciliation ($MM) FY2022 (1) 6/30/22 6/30/23 LTM GAAP Net Income 98 193 56 151 Interest Expense 2 5 5 8 Income Tax Expense 33 68 19 54 Depreciation & Amortization 23 47 28 53 EBITDA 156 313 109 267 (2) Share Based Compensation 6 11 6 12 (3) - - 7 7 Due Diligence and Integration Costs (4) Reduction in Workforce - - 2 2 Adjusted EBITDA 162 325 124 287 Adjusted EBITDA Margin (%) 16% 16% 15% 16% Refer to footnotes on following slides; figures may not foot due to rounding 20
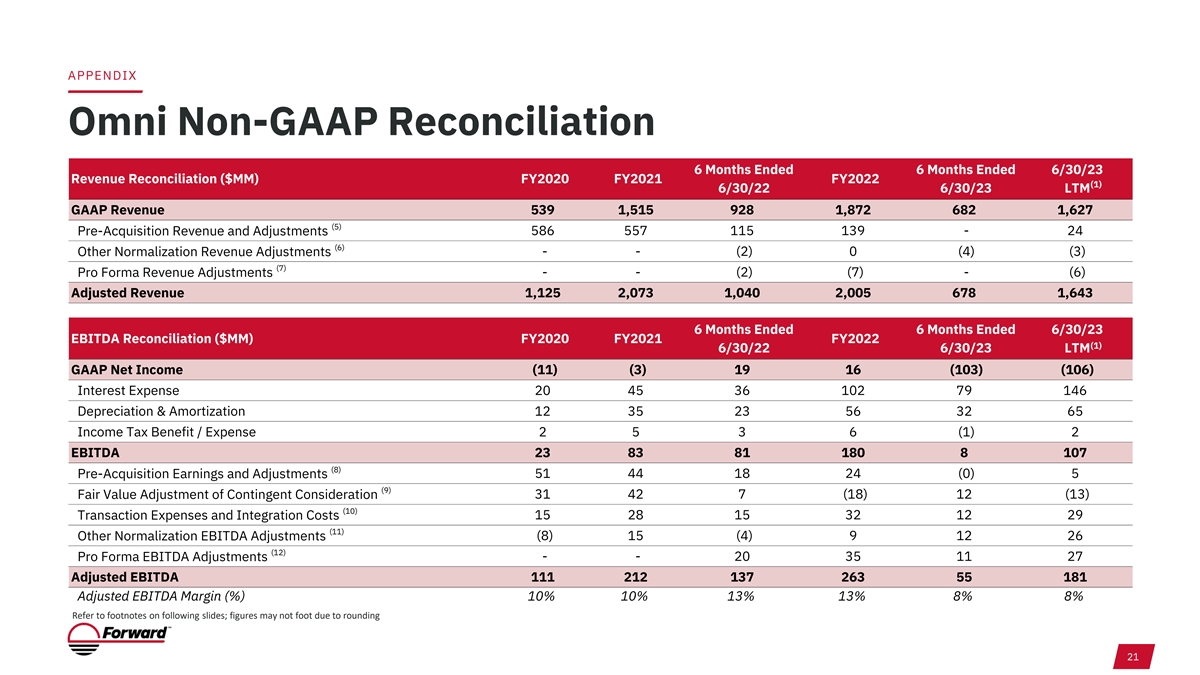
APPENDIX Omni Non-GAAP Reconciliation 6 Months Ended 6 Months Ended 6/30/23 Revenue Reconciliation ($MM) FY2020 FY2021 FY2022 (1) 6/30/22 6/30/23 LTM GAAP Revenue 539 1,515 928 1,872 682 1,627 (5) 586 557 115 139 - 24 Pre-Acquisition Revenue and Adjustments (6) Other Normalization Revenue Adjustments - - (2) 0 (4) (3) (7) - - (2) (7) - (6) Pro Forma Revenue Adjustments Adjusted Revenue 1,125 2,073 1,040 2,005 678 1,643 6 Months Ended 6 Months Ended 6/30/23 EBITDA Reconciliation ($MM) FY2020 FY2021 FY2022 (1) 6/30/22 6/30/23 LTM GAAP Net Income (11) (3) 19 16 (103) (106) Interest Expense 20 45 36 102 79 146 Depreciation & Amortization 12 35 23 56 32 65 Income Tax Benefit / Expense 2 5 3 6 (1) 2 EBITDA 23 83 81 180 8 107 (8) Pre-Acquisition Earnings and Adjustments 51 44 18 24 (0) 5 (9) Fair Value Adjustment of Contingent Consideration 31 42 7 (18) 12 (13) (10) Transaction Expenses and Integration Costs 15 28 15 32 12 29 (11) (8) 15 (4) 9 12 26 Other Normalization EBITDA Adjustments (12) Pro Forma EBITDA Adjustments - - 20 35 11 27 Adjusted EBITDA 111 212 137 263 55 181 Adjusted EBITDA Margin (%) 10% 10% 13% 13% 8% 8% Refer to footnotes on following slides; figures may not foot due to rounding 21
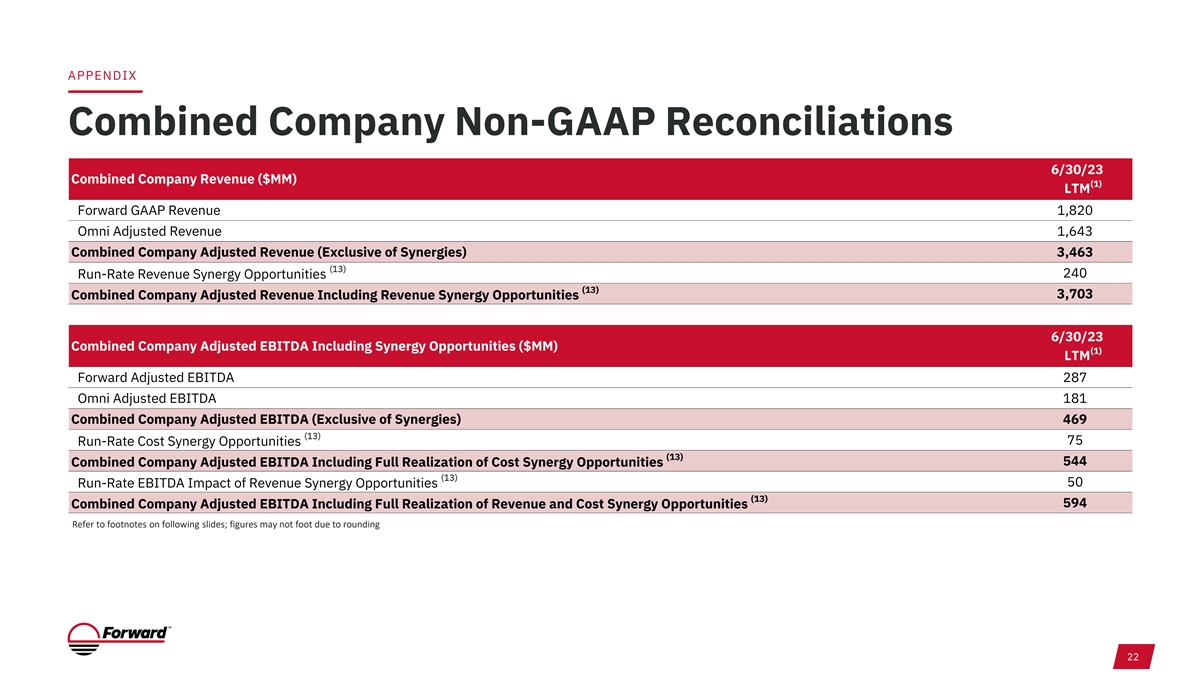
APPENDIX Combined Company Non-GAAP Reconciliations 6/30/23 Combined Company Revenue ($MM) (1) LTM Forward GAAP Revenue 1,820 Omni Adjusted Revenue 1,643 Combined Company Adjusted Revenue (Exclusive of Synergies) 3,463 (13) 240 Run-Rate Revenue Synergy Opportunities (13) 3,703 Combined Company Adjusted Revenue Including Revenue Synergy Opportunities 6/30/23 Combined Company Adjusted EBITDA Including Synergy Opportunities ($MM) (1) LTM Forward Adjusted EBITDA 287 Omni Adjusted EBITDA 181 Combined Company Adjusted EBITDA (Exclusive of Synergies) 469 (13) 75 Run-Rate Cost Synergy Opportunities (13) 544 Combined Company Adjusted EBITDA Including Full Realization of Cost Synergy Opportunities (13) 50 Run-Rate EBITDA Impact of Revenue Synergy Opportunities (13) 594 Combined Company Adjusted EBITDA Including Full Realization of Revenue and Cost Synergy Opportunities Refer to footnotes on following slides; figures may not foot due to rounding 22
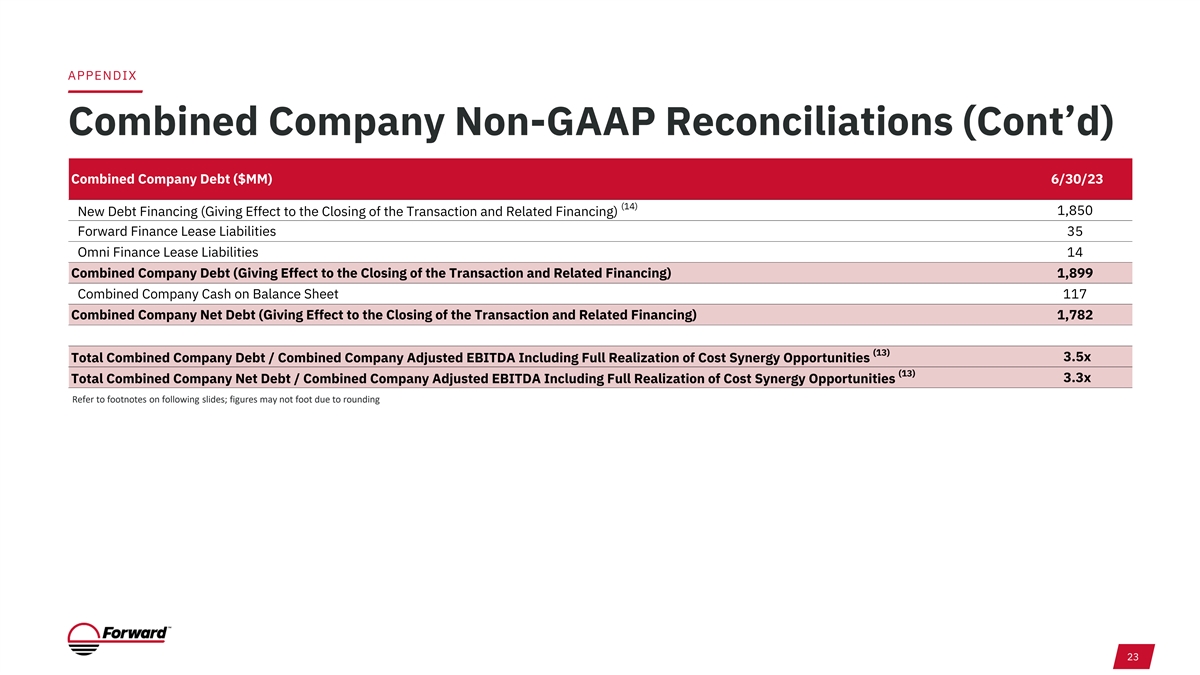
APPENDIX Combined Company Non-GAAP Reconciliations (Cont’d) Combined Company Debt ($MM) 6/30/23 (14) 1,850 New Debt Financing (Giving Effect to the Closing of the Transaction and Related Financing) Forward Finance Lease Liabilities 35 Omni Finance Lease Liabilities 14 Combined Company Debt (Giving Effect to the Closing of the Transaction and Related Financing) 1,899 Combined Company Cash on Balance Sheet 117 Combined Company Net Debt (Giving Effect to the Closing of the Transaction and Related Financing) 1,782 (13) 3.5x Total Combined Company Debt / Combined Company Adjusted EBITDA Including Full Realization of Cost Synergy Opportunities (13) 3.3x Total Combined Company Net Debt / Combined Company Adjusted EBITDA Including Full Realization of Cost Synergy Opportunities Refer to footnotes on following slides; figures may not foot due to rounding 23
APPENDIX Non-GAAP Reconciliation Footnotes 1. June 30, 2023 LTM figures calculated as (i) such figures for the fiscal year 9. Omni Fair Value Adjustment of Contingent Consideration – represents removal ended December 31, 2022 plus (ii) such figures for the six months ended June of fair value adjustments for performance based earn-out payments for certain 30, 2023 less (iii) such figures for the six months ended June 30, 2022 acquired entities 2. Forward Share Based Compensation – relates to non-cash stock compensation 10. Omni Transaction Expenses and Integration Costs – represents advisor fees expense and due diligence costs related to executed and terminated acquisitions as well as integration-related expenses of certain acquired businesses 3. Forward Due Diligence and Integration Costs – represents advisor fees and due diligence costs related to executed and terminated acquisitions as well as 11. Omni Other Normalization EBITDA Adjustments – represents items considered integration-related expenses of acquired businesses non-operational or non-recurring such as non-recurring bad debt expenses, sponsor and board fees, FX gains and losses, and other non-recurring and non- 4. Forward Reduction in Workforce – represents impact of a Forward Air 2023 cash expenses reduction in workforce initiative 12. Omni Pro Forma EBITDA Adjustments – represents pro forma impact of 5. Omni Pre-acquisition Revenue and Adjustments – represents revenue of certain strategic initiatives, updated customer pricing, and profitability initiatives entities acquired during the applicable period, inclusive of due diligence including facilities consolidations and a reduction-in-force in 2022 and 2023, adjustments, attributable to the portion of such period occurring prior to the as if each of the foregoing was implemented as of the first day of the applicable consummation of their respective acquisition period 6. Omni Other Normalization Revenue Adjustments – represents items considered 13. Assumes full realization of expected synergy opportunities, based on non-operational, non-recurring, or non-cash in nature management estimates. Synergy opportunities are exclusive of one-time costs necessary to achieve such synergies, estimated to be approximately $36MM. 7. Omni Pro Forma Revenue Adjustments – represents pro-forma impact of Estimated revenue-based EBITDA synergy opportunities have been converted strategic initiatives and updated customer pricing as if each of the foregoing into EBITDA estimates assuming the full realization of the revenue synergy was implemented as of the first day of the applicable period opportunities, based on an assumed margin percentage of 21%. This assumed 8. Omni Pre-acquisition Earnings and Adjustments – represents earnings of margin percentage is based on management’s estimates and an analysis of certain entities acquired during the applicable period, inclusive of due diligence incremental margin by revenue segment adjustments, attributable to the portion of such period occurring prior to the 14. Each of Forward’s and Omni’s existing credit facilities is expected to be repaid consummation of their respective acquisition at closing 24